| __timestamp | Infosys Limited | TE Connectivity Ltd. |
|---|---|---|
| Wednesday, January 1, 2014 | 1079000000 | 1882000000 |
| Thursday, January 1, 2015 | 1176000000 | 1504000000 |
| Friday, January 1, 2016 | 1020000000 | 1463000000 |
| Sunday, January 1, 2017 | 1279000000 | 1591000000 |
| Monday, January 1, 2018 | 1220000000 | 1594000000 |
| Tuesday, January 1, 2019 | 1504000000 | 1490000000 |
| Wednesday, January 1, 2020 | 1223000000 | 1392000000 |
| Friday, January 1, 2021 | 1391000000 | 1512000000 |
| Saturday, January 1, 2022 | 1678000000 | 1584000000 |
| Sunday, January 1, 2023 | 1632000000 | 1670000000 |
| Monday, January 1, 2024 | 1732000000 |
Cracking the code
In the ever-evolving landscape of global business, understanding the financial health of companies is crucial. This analysis delves into the Selling, General, and Administrative (SG&A) expenses of two industry giants: Infosys Limited and TE Connectivity Ltd., from 2014 to 2023.
Infosys, a leader in IT services, has seen its SG&A expenses grow by approximately 51% over the decade, peaking in 2022. Meanwhile, TE Connectivity, a key player in connectivity and sensor solutions, experienced a more modest increase of around 8% during the same period. Notably, TE Connectivity consistently outspent Infosys, with expenses reaching their highest in 2014.
This financial snapshot highlights the strategic differences in operational spending between these two companies, offering insights into their business models and market strategies. Missing data for Infosys in 2024 suggests a need for further investigation into recent trends.
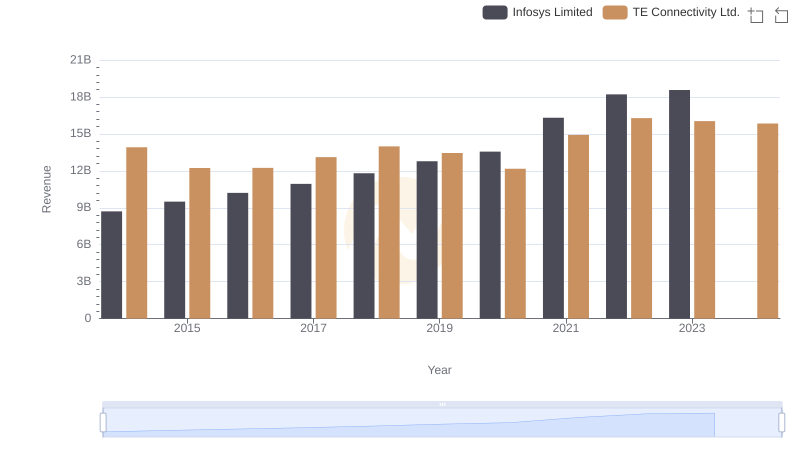
Infosys Limited or TE Connectivity Ltd.: Who Leads in Yearly Revenue?
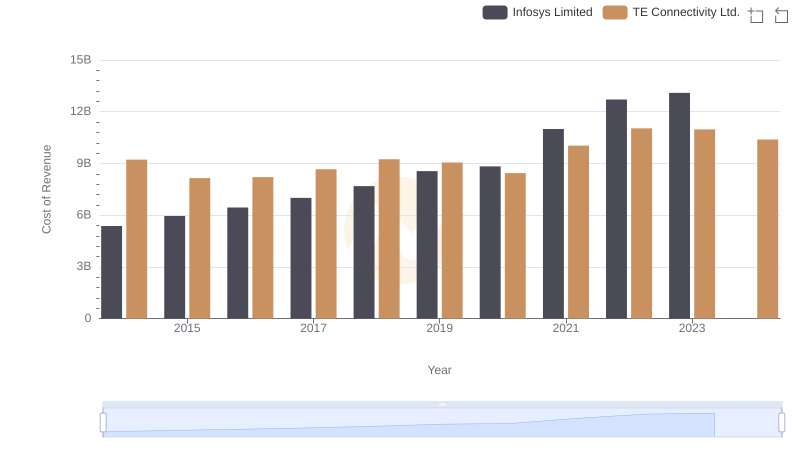
Cost Insights: Breaking Down Infosys Limited and TE Connectivity Ltd.'s Expenses
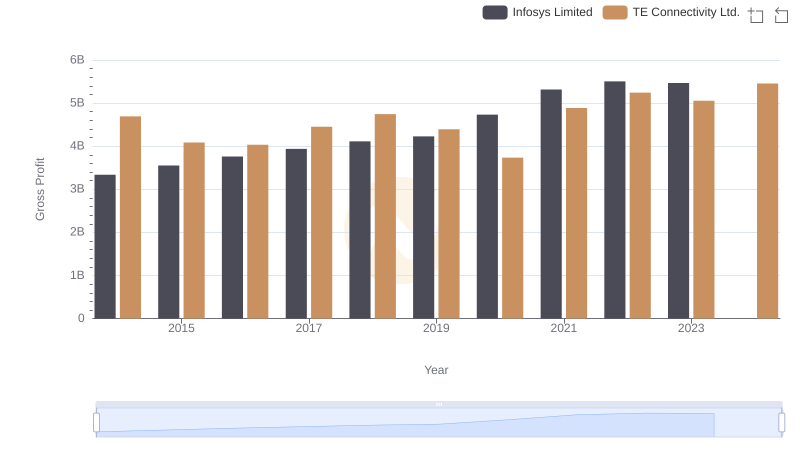
Who Generates Higher Gross Profit? Infosys Limited or TE Connectivity Ltd.
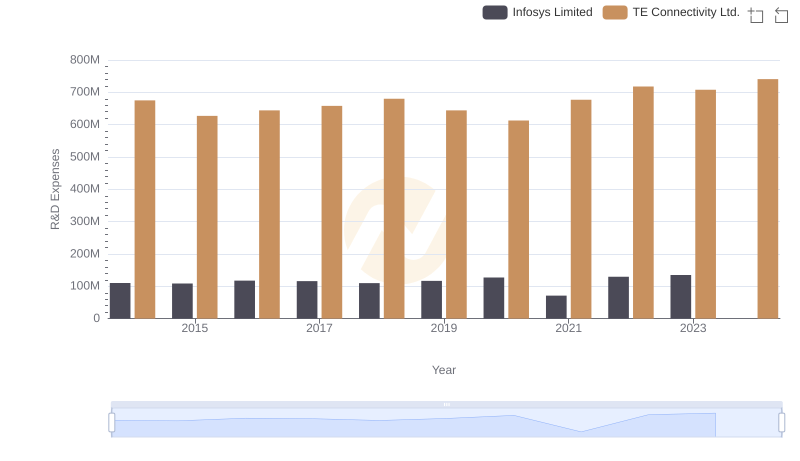
Comparing Innovation Spending: Infosys Limited and TE Connectivity Ltd.
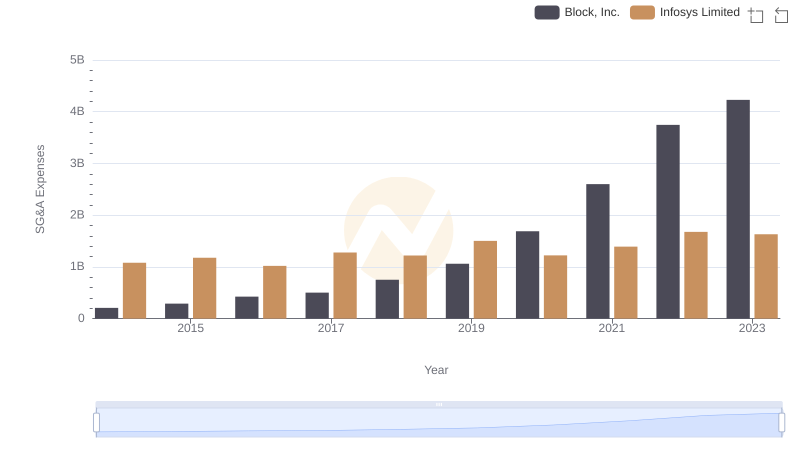
Infosys Limited vs Block, Inc.: SG&A Expense Trends
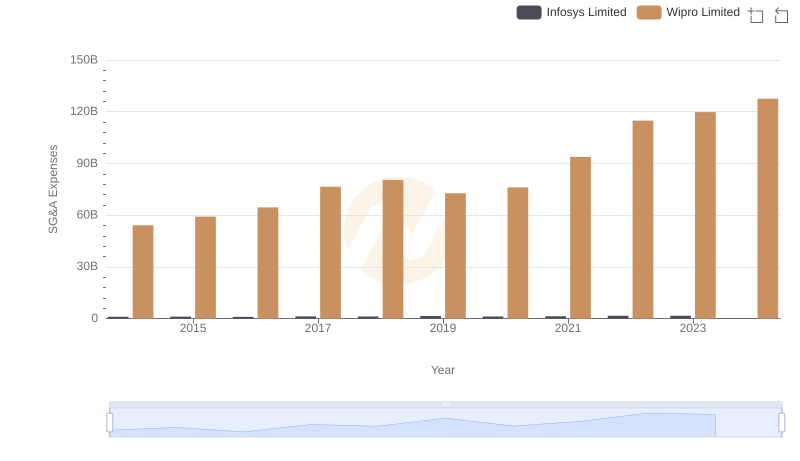
Cost Management Insights: SG&A Expenses for Infosys Limited and Wipro Limited
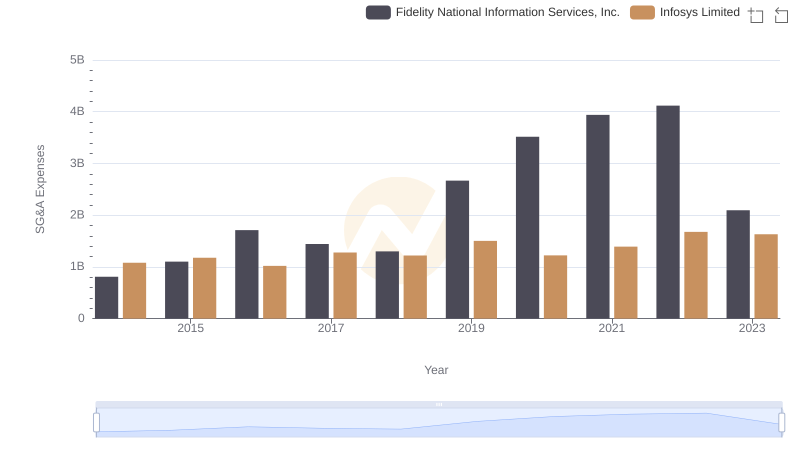
Operational Costs Compared: SG&A Analysis of Infosys Limited and Fidelity National Information Services, Inc.
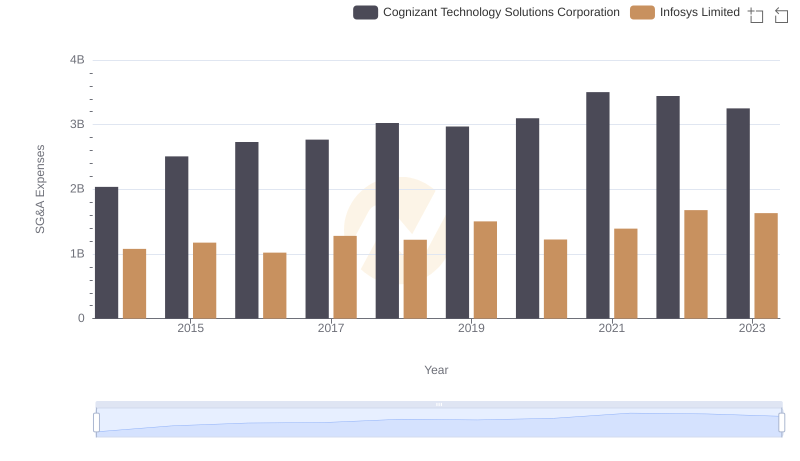
Infosys Limited and Cognizant Technology Solutions Corporation: SG&A Spending Patterns Compared
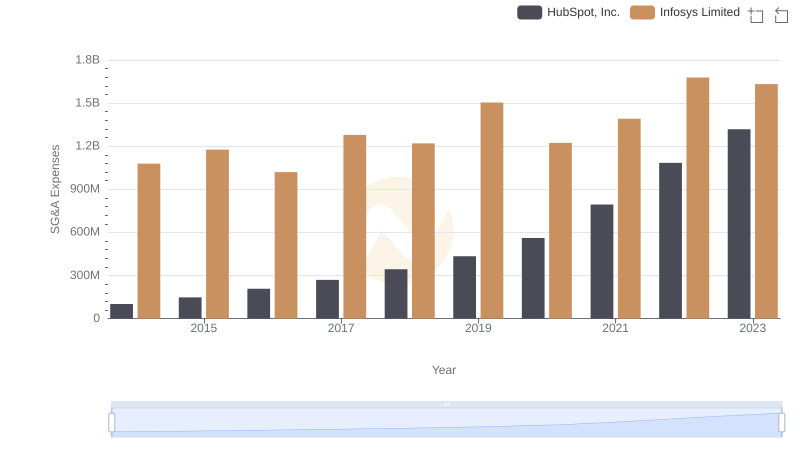
Infosys Limited or HubSpot, Inc.: Who Manages SG&A Costs Better?
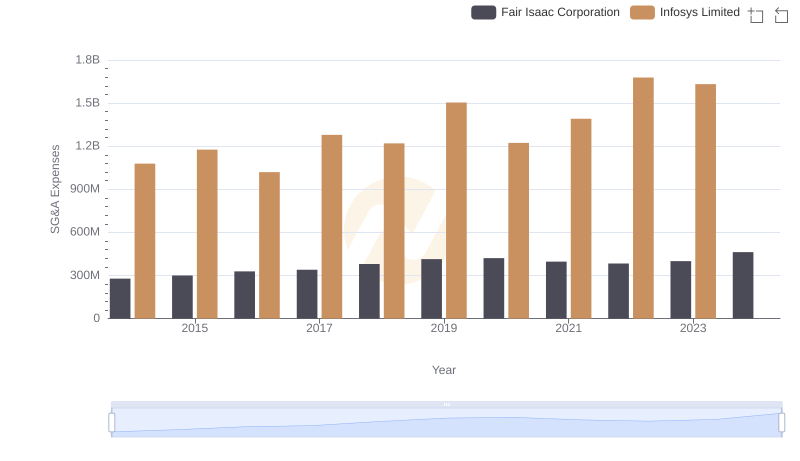
Who Optimizes SG&A Costs Better? Infosys Limited or Fair Isaac Corporation
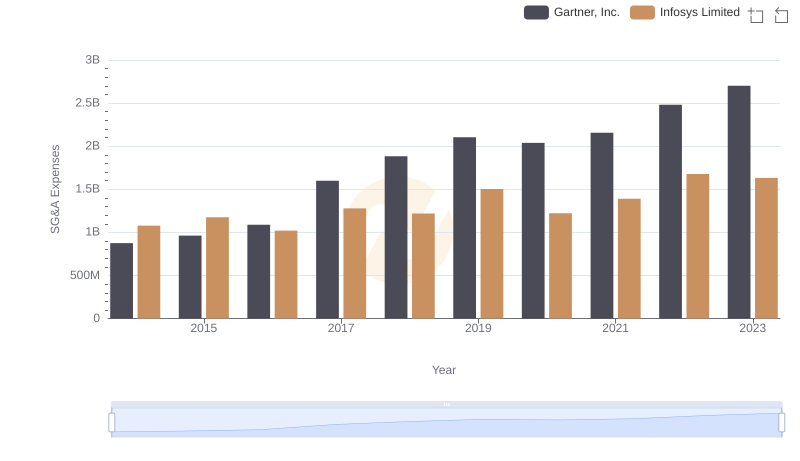
Cost Management Insights: SG&A Expenses for Infosys Limited and Gartner, Inc.
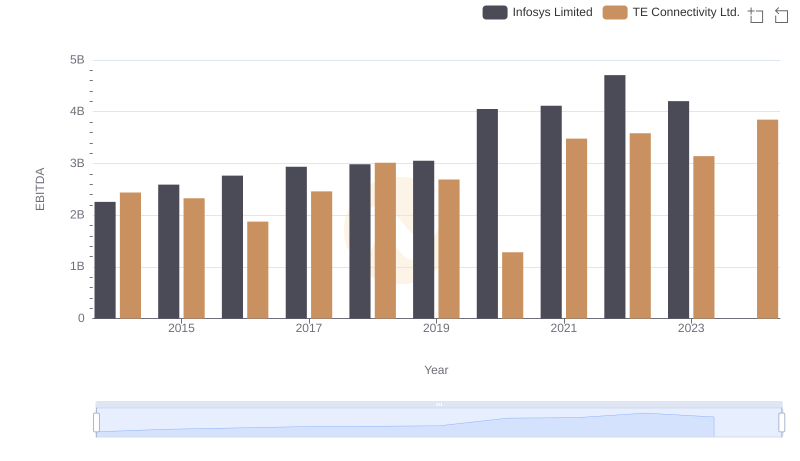
Professional EBITDA Benchmarking: Infosys Limited vs TE Connectivity Ltd.