| __timestamp | Fidelity National Information Services, Inc. | Infosys Limited |
|---|---|---|
| Wednesday, January 1, 2014 | 1846200000 | 2258000000 |
| Thursday, January 1, 2015 | 1901000000 | 2590000000 |
| Friday, January 1, 2016 | 2474000000 | 2765000000 |
| Sunday, January 1, 2017 | 2700000000 | 2936000000 |
| Monday, January 1, 2018 | 2837000000 | 2984000000 |
| Tuesday, January 1, 2019 | 3244000000 | 3053000000 |
| Wednesday, January 1, 2020 | 4319000000 | 4053342784 |
| Friday, January 1, 2021 | 5021000000 | 4116000000 |
| Saturday, January 1, 2022 | 2875000000 | 4707334610 |
| Sunday, January 1, 2023 | 2906000000 | 4206000000 |
| Monday, January 1, 2024 | 1709000000 |
Unlocking the unknown
In the ever-evolving landscape of global technology and financial services, the EBITDA performance of Infosys Limited and Fidelity National Information Services, Inc. (FIS) offers a fascinating glimpse into their financial health over the past decade. From 2014 to 2023, Infosys consistently outperformed FIS, with an average EBITDA of approximately $3.37 billion, compared to FIS's $3.01 billion. Notably, Infosys saw a remarkable 86% increase in EBITDA from 2014 to 2023, peaking in 2022 with a 108% rise from its 2014 figures. Meanwhile, FIS experienced a more volatile journey, with a significant peak in 2021, where EBITDA surged by 172% from 2014, only to drop by 42% in 2022. This data underscores the resilience and strategic prowess of Infosys in maintaining steady growth, while FIS's fluctuations highlight the challenges faced in the financial services sector.
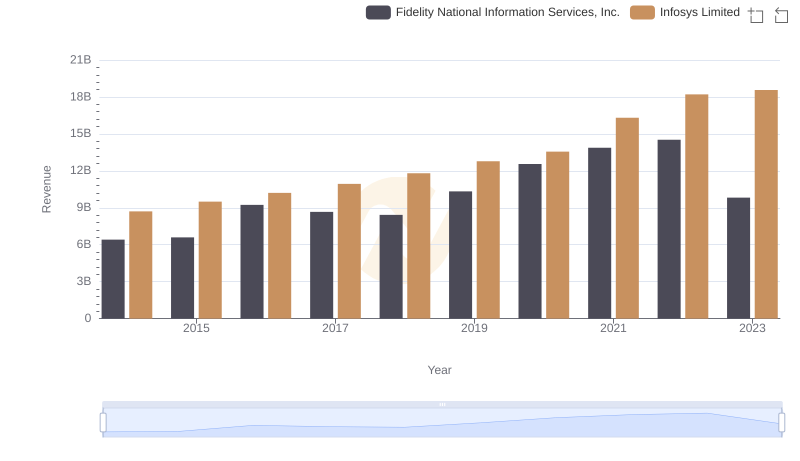
Comparing Revenue Performance: Infosys Limited or Fidelity National Information Services, Inc.?
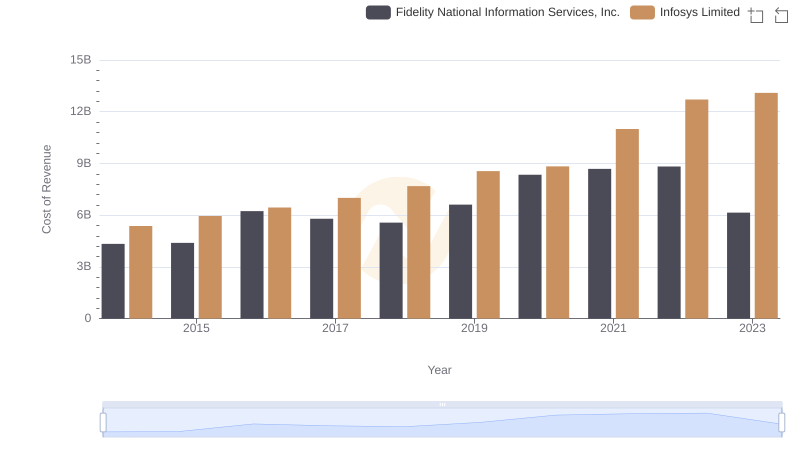
Infosys Limited vs Fidelity National Information Services, Inc.: Efficiency in Cost of Revenue Explored
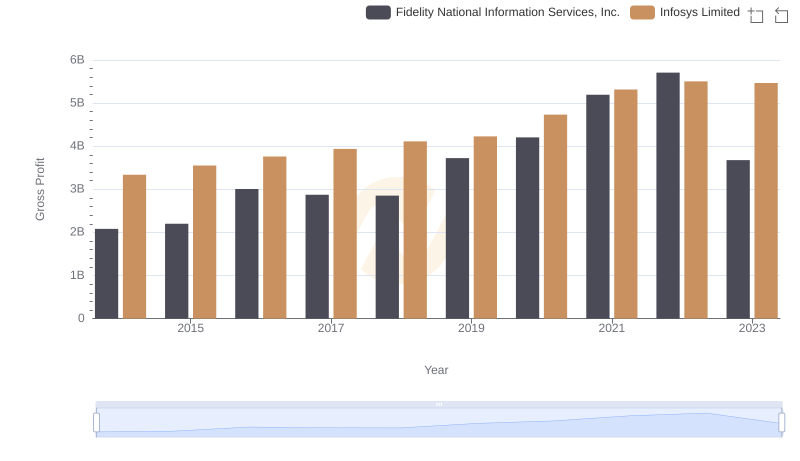
Who Generates Higher Gross Profit? Infosys Limited or Fidelity National Information Services, Inc.
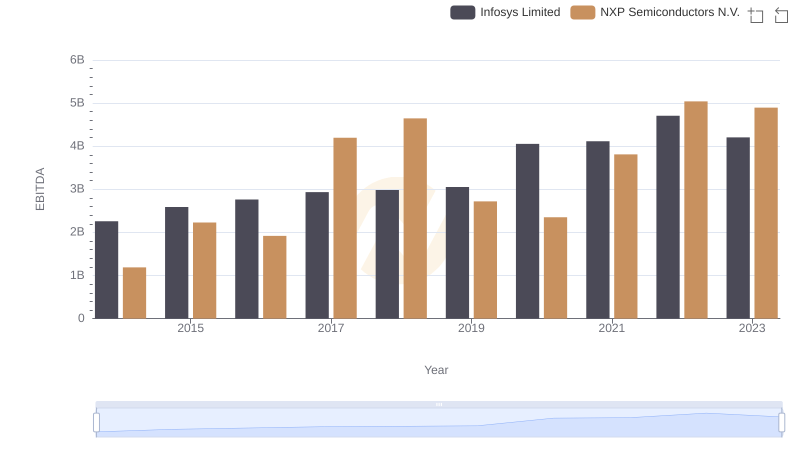
EBITDA Metrics Evaluated: Infosys Limited vs NXP Semiconductors N.V.
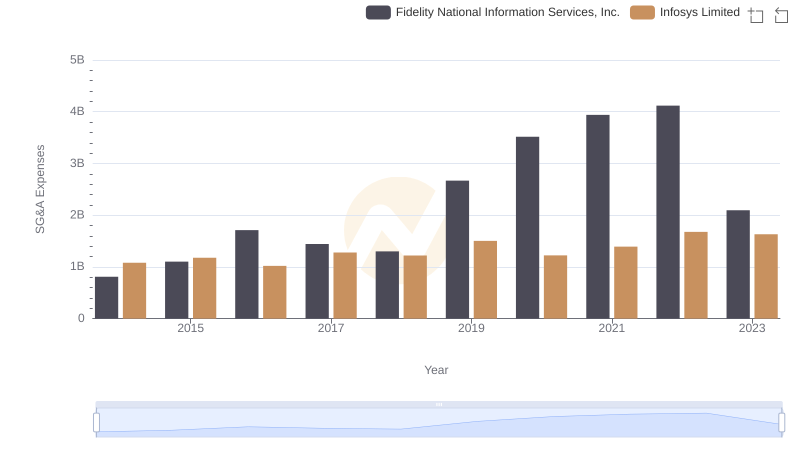
Operational Costs Compared: SG&A Analysis of Infosys Limited and Fidelity National Information Services, Inc.
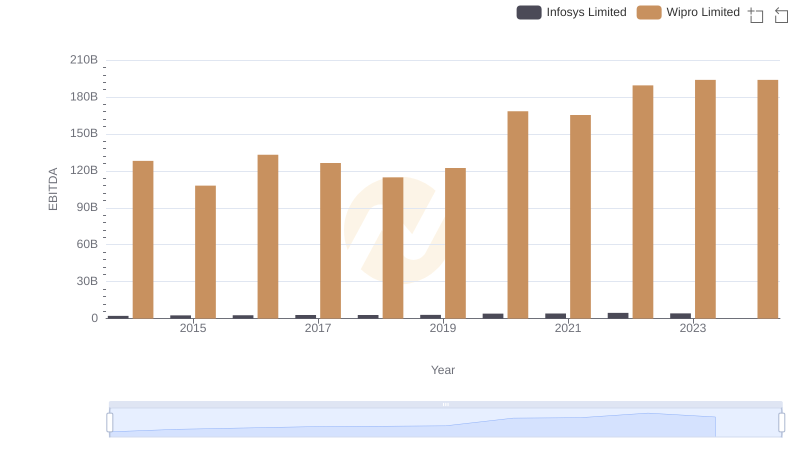
Comparative EBITDA Analysis: Infosys Limited vs Wipro Limited
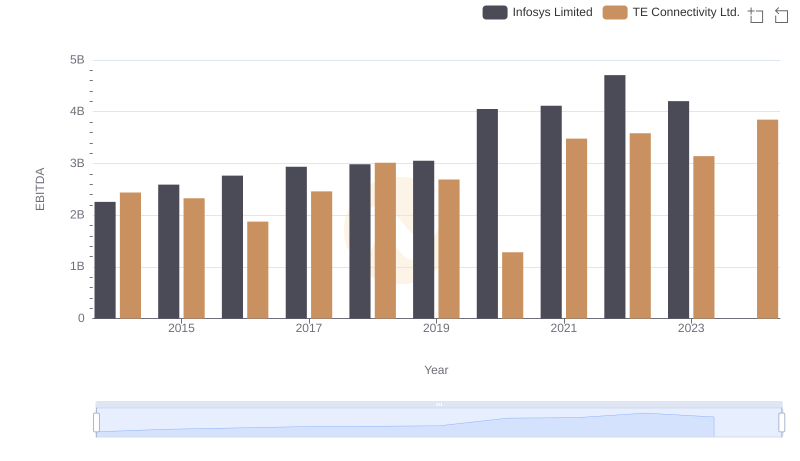
Professional EBITDA Benchmarking: Infosys Limited vs TE Connectivity Ltd.
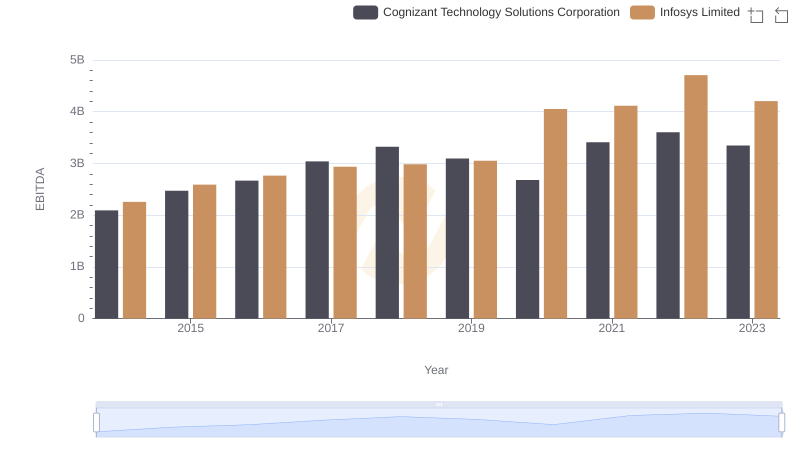
Professional EBITDA Benchmarking: Infosys Limited vs Cognizant Technology Solutions Corporation
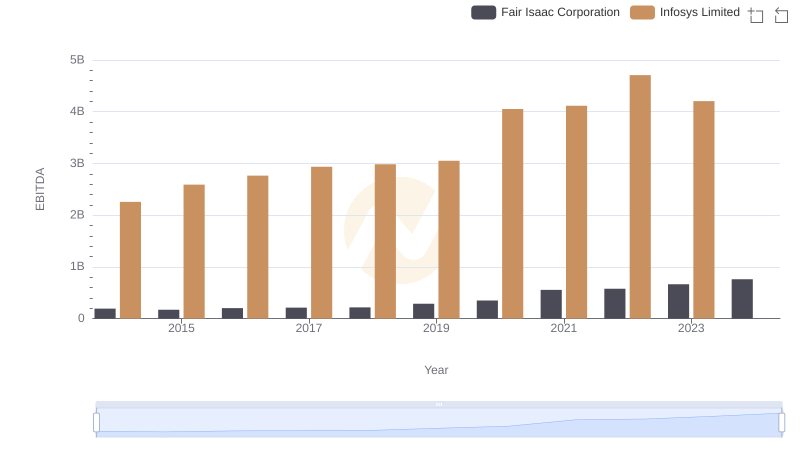
A Side-by-Side Analysis of EBITDA: Infosys Limited and Fair Isaac Corporation
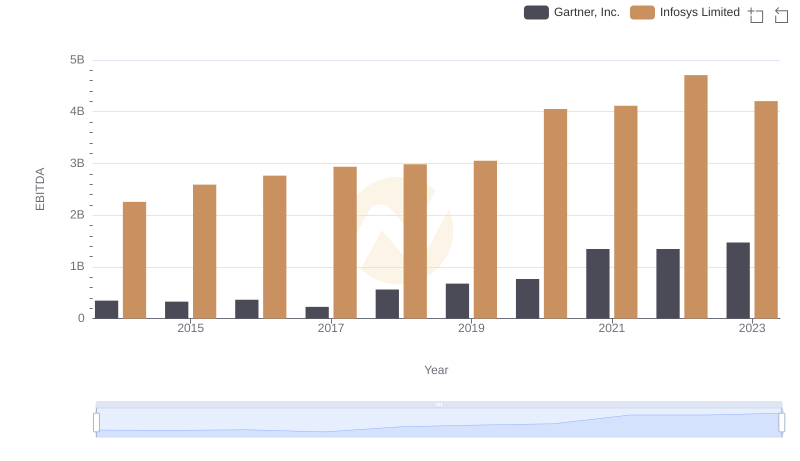
A Side-by-Side Analysis of EBITDA: Infosys Limited and Gartner, Inc.
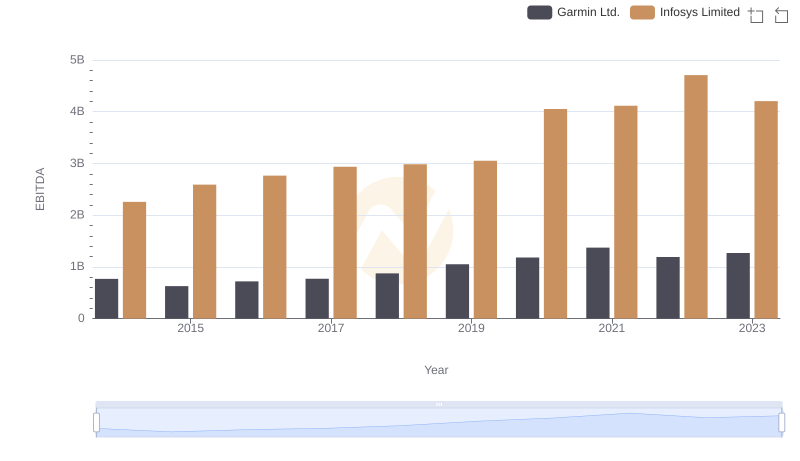
EBITDA Analysis: Evaluating Infosys Limited Against Garmin Ltd.
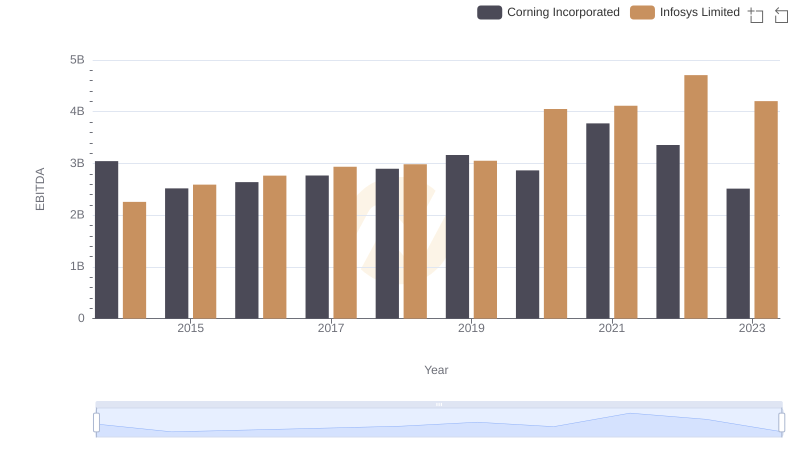
Comprehensive EBITDA Comparison: Infosys Limited vs Corning Incorporated