| __timestamp | ASE Technology Holding Co., Ltd. | Infosys Limited |
|---|---|---|
| Wednesday, January 1, 2014 | 57728376000 | 2258000000 |
| Thursday, January 1, 2015 | 56716330000 | 2590000000 |
| Friday, January 1, 2016 | 58196307000 | 2765000000 |
| Sunday, January 1, 2017 | 61377328000 | 2936000000 |
| Monday, January 1, 2018 | 78432873000 | 2984000000 |
| Tuesday, January 1, 2019 | 77173662000 | 3053000000 |
| Wednesday, January 1, 2020 | 89377502000 | 4053342784 |
| Friday, January 1, 2021 | 135966088000 | 4116000000 |
| Saturday, January 1, 2022 | 138852591000 | 4707334610 |
| Sunday, January 1, 2023 | 104757657000 | 4206000000 |
| Monday, January 1, 2024 | 104735170000 |
Unleashing insights
In the ever-evolving landscape of global technology, two giants stand out: Infosys Limited and ASE Technology Holding Co., Ltd. Over the past decade, these companies have demonstrated remarkable EBITDA growth, reflecting their strategic prowess and market adaptability.
From 2014 to 2023, Infosys Limited has seen a consistent upward trajectory in its EBITDA, growing by approximately 86%. This steady climb underscores Infosys's robust business model and its ability to navigate the competitive IT services sector.
In contrast, ASE Technology Holding Co., Ltd. has experienced a staggering 81% increase in EBITDA over the same period. This rapid surge highlights ASE's dominance in the semiconductor industry, driven by increasing global demand for electronic components.
While both companies have shown impressive growth, ASE's more aggressive expansion strategy has resulted in a higher EBITDA, showcasing its leadership in the tech manufacturing space.
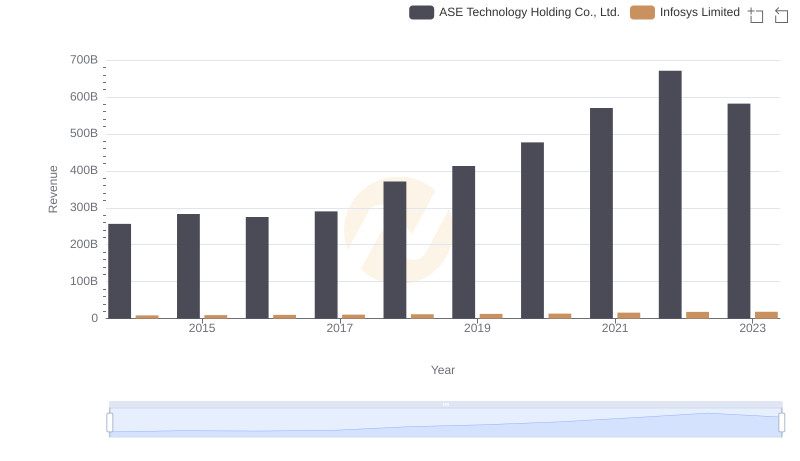
Comparing Revenue Performance: Infosys Limited or ASE Technology Holding Co., Ltd.?
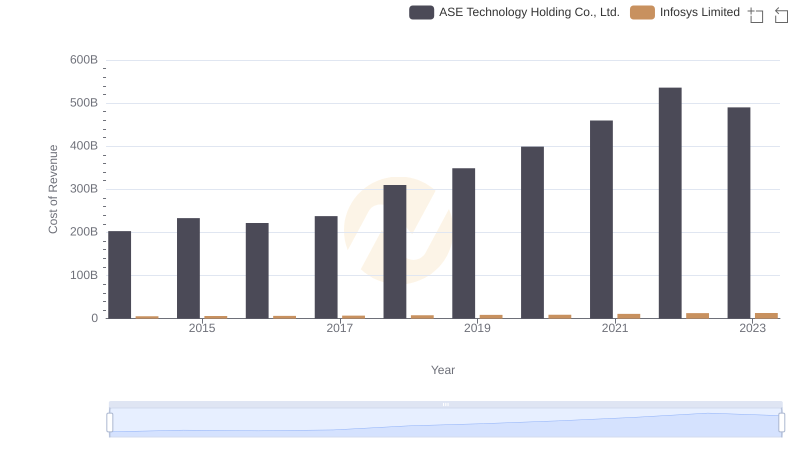
Cost of Revenue: Key Insights for Infosys Limited and ASE Technology Holding Co., Ltd.
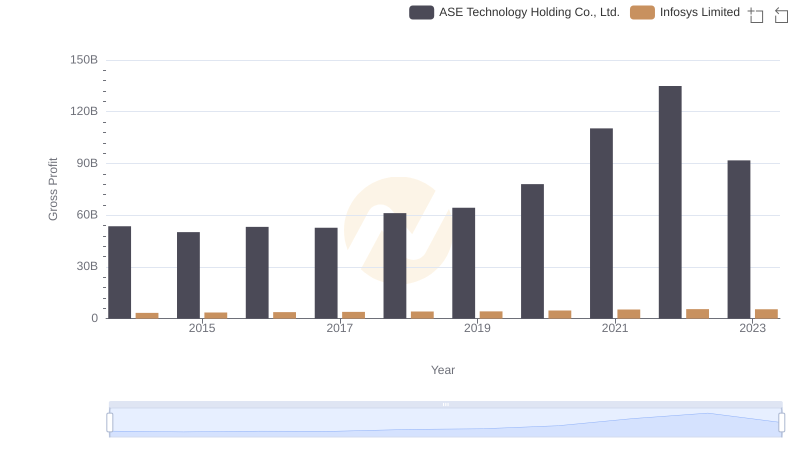
Gross Profit Trends Compared: Infosys Limited vs ASE Technology Holding Co., Ltd.
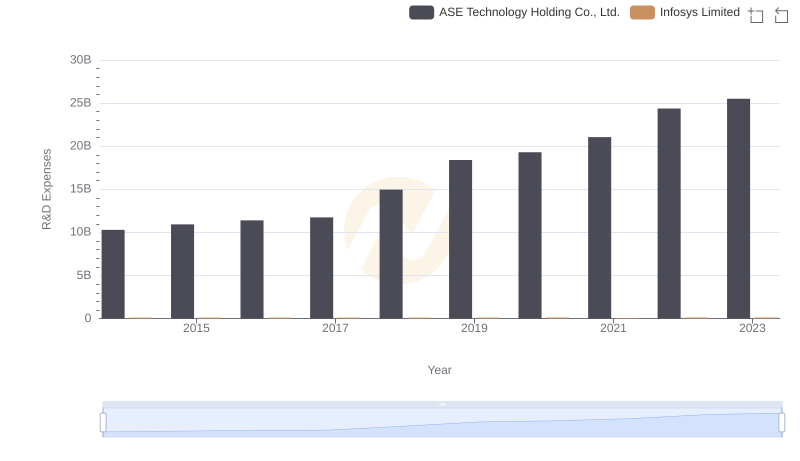
Research and Development: Comparing Key Metrics for Infosys Limited and ASE Technology Holding Co., Ltd.
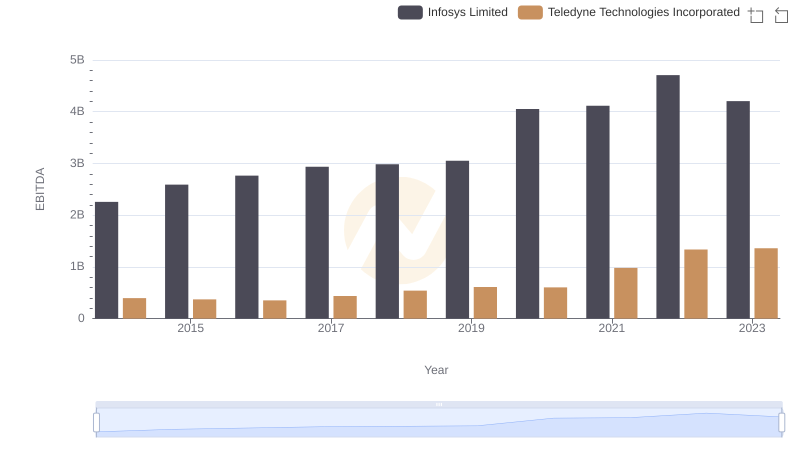
EBITDA Performance Review: Infosys Limited vs Teledyne Technologies Incorporated
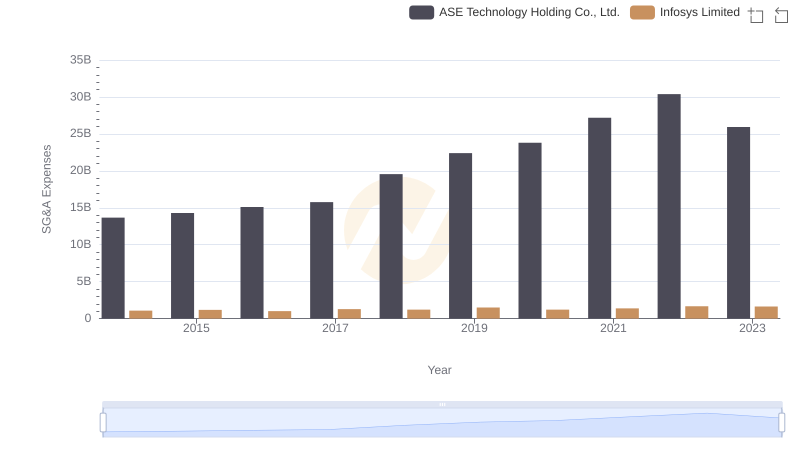
Selling, General, and Administrative Costs: Infosys Limited vs ASE Technology Holding Co., Ltd.
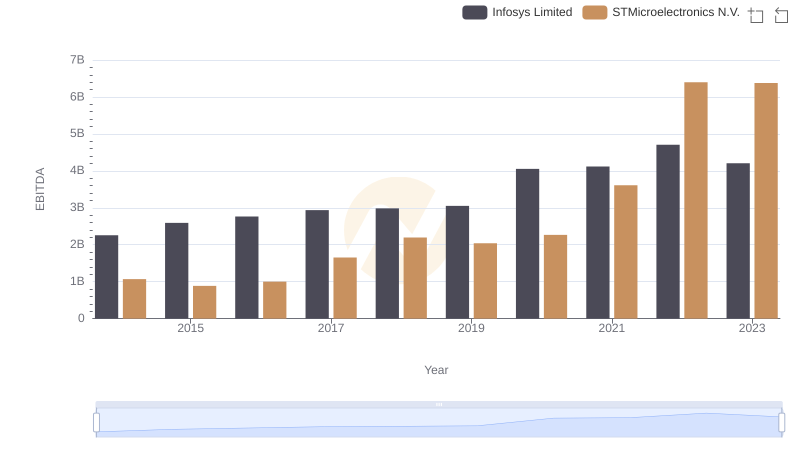
Professional EBITDA Benchmarking: Infosys Limited vs STMicroelectronics N.V.
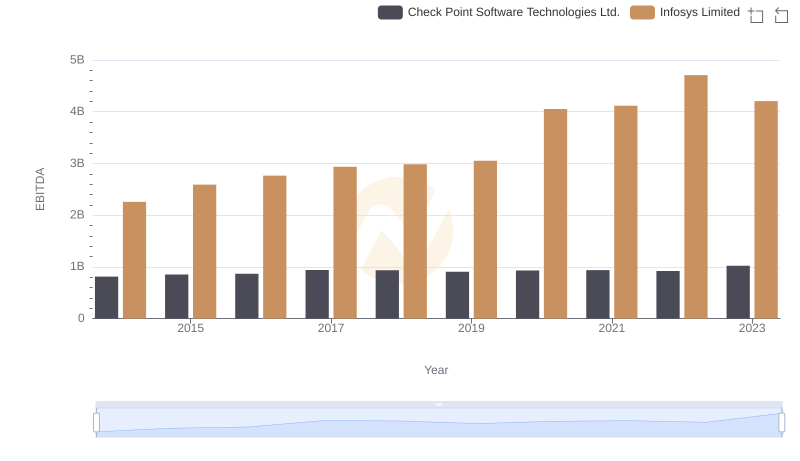
EBITDA Analysis: Evaluating Infosys Limited Against Check Point Software Technologies Ltd.
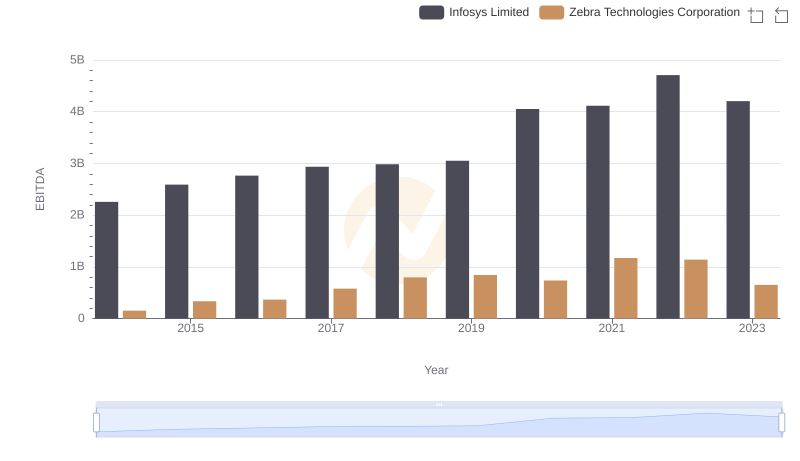
Comprehensive EBITDA Comparison: Infosys Limited vs Zebra Technologies Corporation
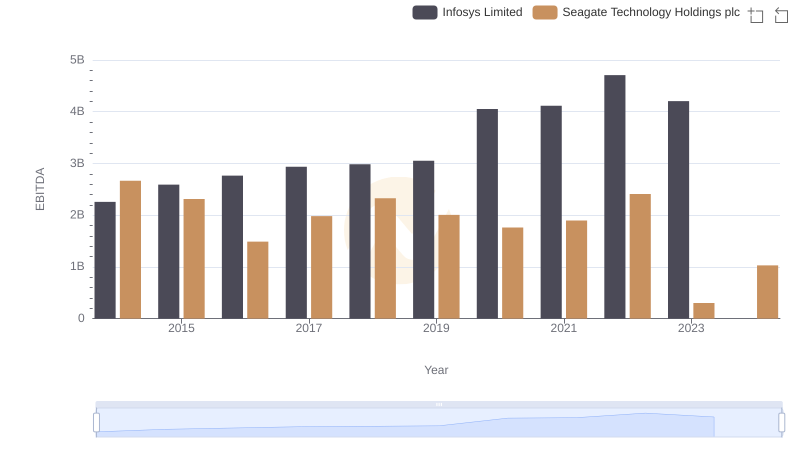
Comparative EBITDA Analysis: Infosys Limited vs Seagate Technology Holdings plc
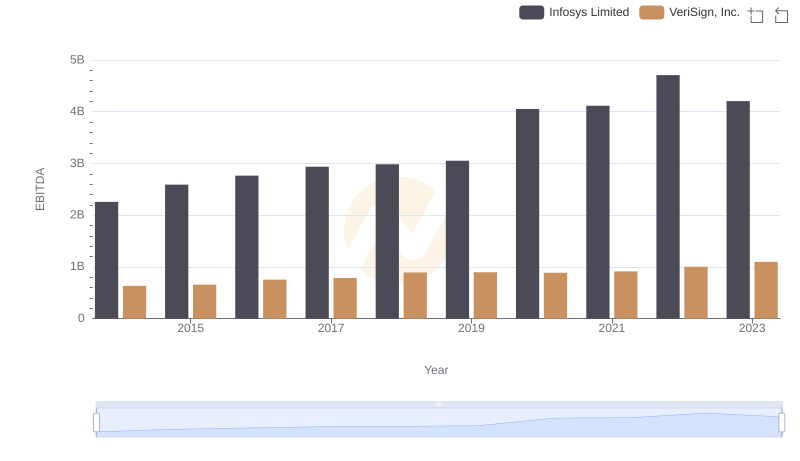
EBITDA Analysis: Evaluating Infosys Limited Against VeriSign, Inc.
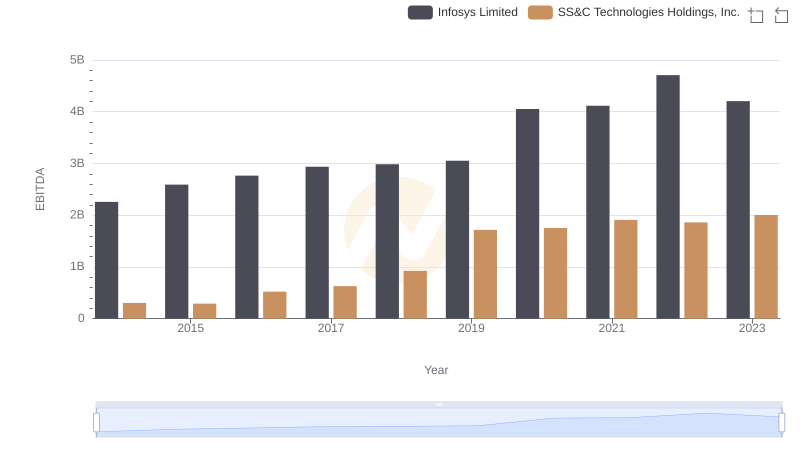
Comparative EBITDA Analysis: Infosys Limited vs SS&C Technologies Holdings, Inc.