| __timestamp | ASE Technology Holding Co., Ltd. | Infosys Limited |
|---|---|---|
| Wednesday, January 1, 2014 | 256591000000 | 8711000000 |
| Thursday, January 1, 2015 | 283302000000 | 9501000000 |
| Friday, January 1, 2016 | 274884000000 | 10208000000 |
| Sunday, January 1, 2017 | 290441000000 | 10939000000 |
| Monday, January 1, 2018 | 371092000000 | 11799000000 |
| Tuesday, January 1, 2019 | 413182000000 | 12780000000 |
| Wednesday, January 1, 2020 | 476978000000 | 13561000000 |
| Friday, January 1, 2021 | 569997000000 | 16311000000 |
| Saturday, January 1, 2022 | 670873000000 | 18212000000 |
| Sunday, January 1, 2023 | 581914471000 | 18562000000 |
| Monday, January 1, 2024 | 595410063000 |
Unlocking the unknown
In the ever-evolving landscape of global technology, two companies stand out for their impressive revenue trajectories over the past decade: Infosys Limited and ASE Technology Holding Co., Ltd. From 2014 to 2023, ASE Technology's revenue surged by approximately 127%, showcasing its robust growth in the semiconductor industry. Meanwhile, Infosys, a leader in IT services, experienced a steady revenue increase of around 113% during the same period.
ASE Technology's revenue peaked in 2022, reaching a remarkable 670 billion, before slightly declining in 2023. In contrast, Infosys demonstrated consistent growth, culminating in a revenue of nearly 19 billion in 2023. This comparison highlights the dynamic nature of the tech industry, where both companies have successfully navigated challenges and capitalized on opportunities. As we look to the future, these trends offer valuable insights into the strategic directions of these industry titans.
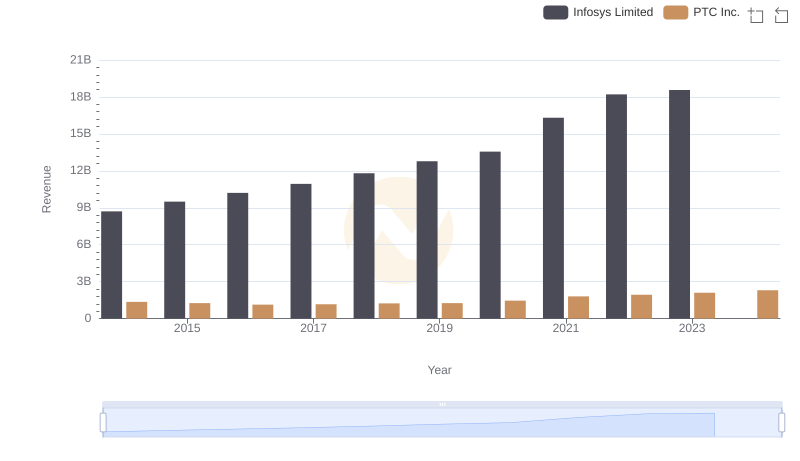
Who Generates More Revenue? Infosys Limited or PTC Inc.
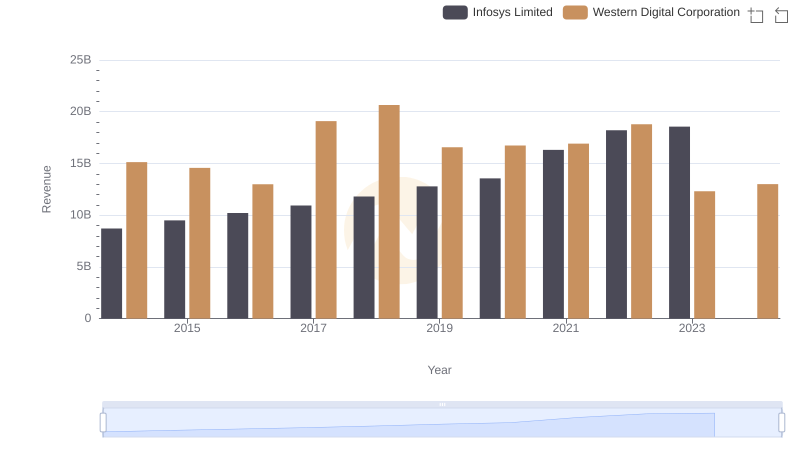
Infosys Limited and Western Digital Corporation: A Comprehensive Revenue Analysis
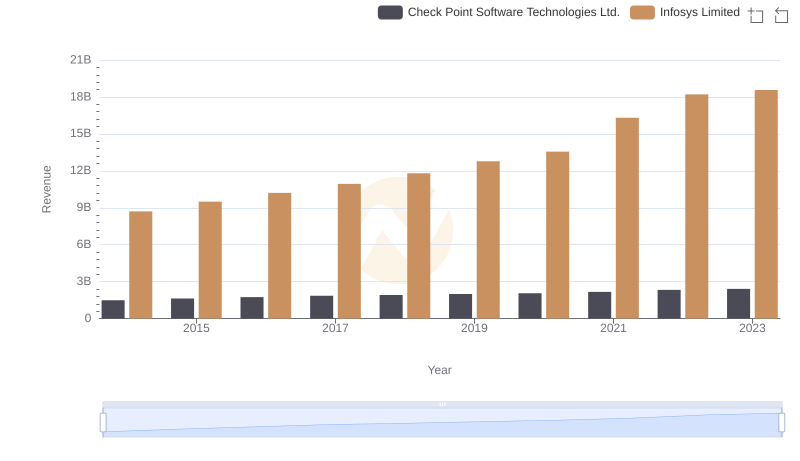
Annual Revenue Comparison: Infosys Limited vs Check Point Software Technologies Ltd.
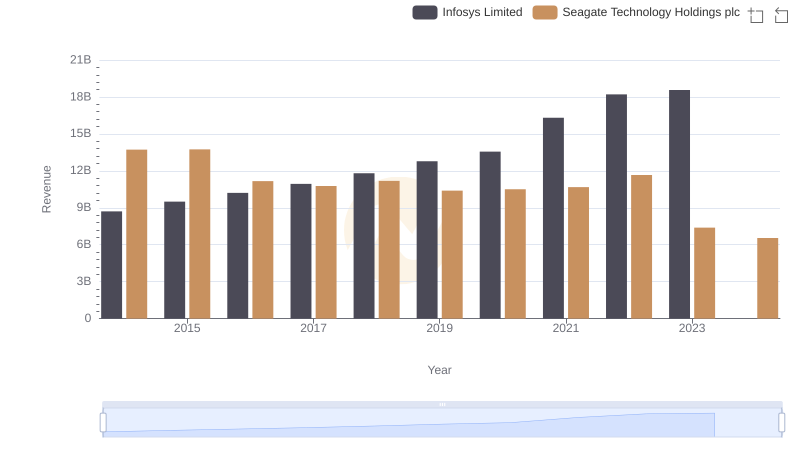
Infosys Limited or Seagate Technology Holdings plc: Who Leads in Yearly Revenue?
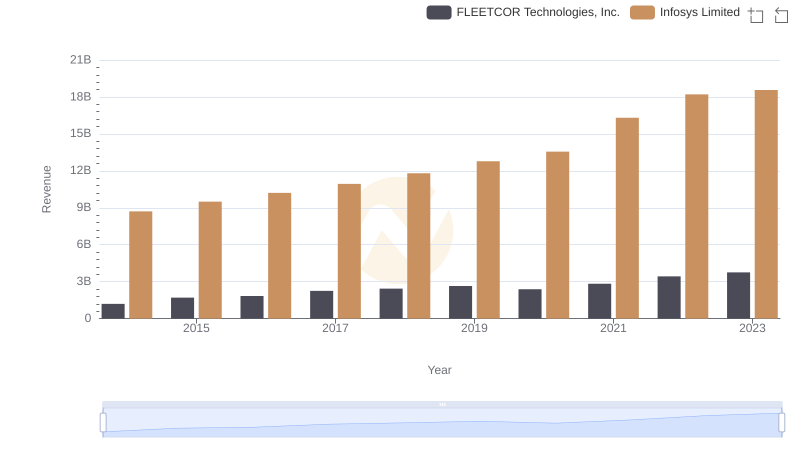
Breaking Down Revenue Trends: Infosys Limited vs FLEETCOR Technologies, Inc.
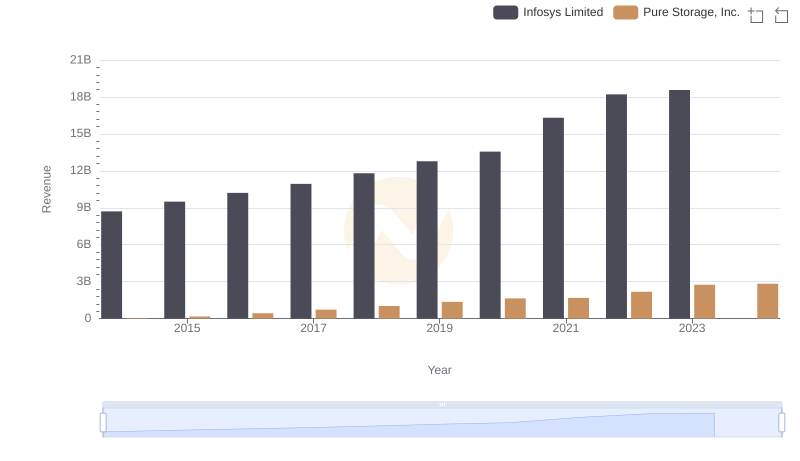
Infosys Limited or Pure Storage, Inc.: Who Leads in Yearly Revenue?
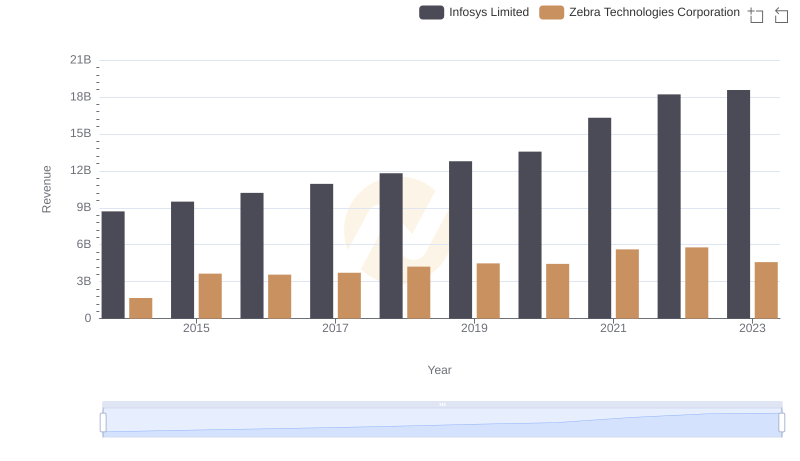
Revenue Showdown: Infosys Limited vs Zebra Technologies Corporation
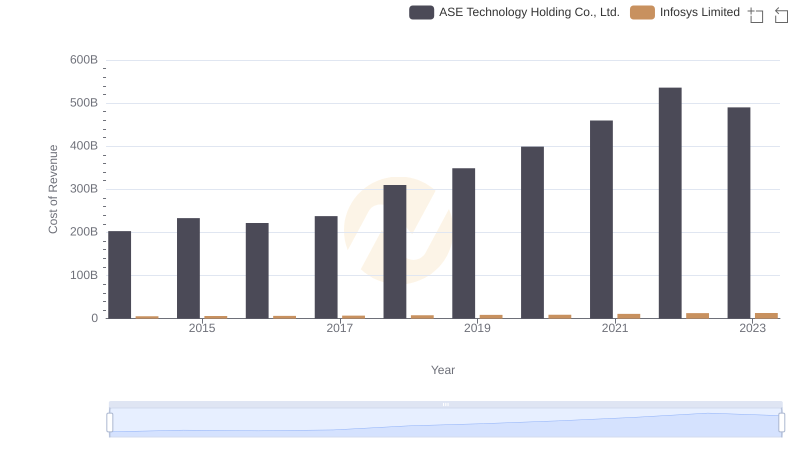
Cost of Revenue: Key Insights for Infosys Limited and ASE Technology Holding Co., Ltd.
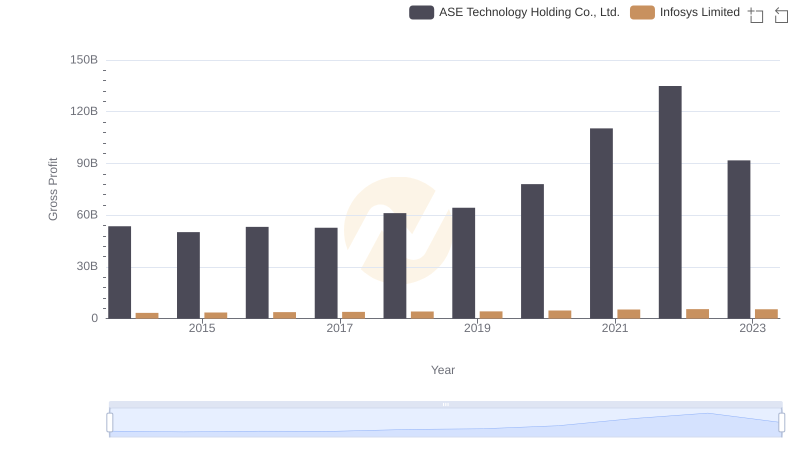
Gross Profit Trends Compared: Infosys Limited vs ASE Technology Holding Co., Ltd.
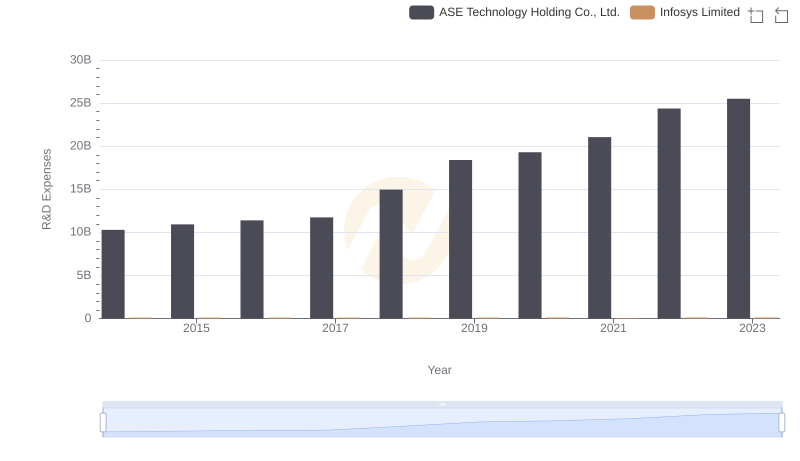
Research and Development: Comparing Key Metrics for Infosys Limited and ASE Technology Holding Co., Ltd.
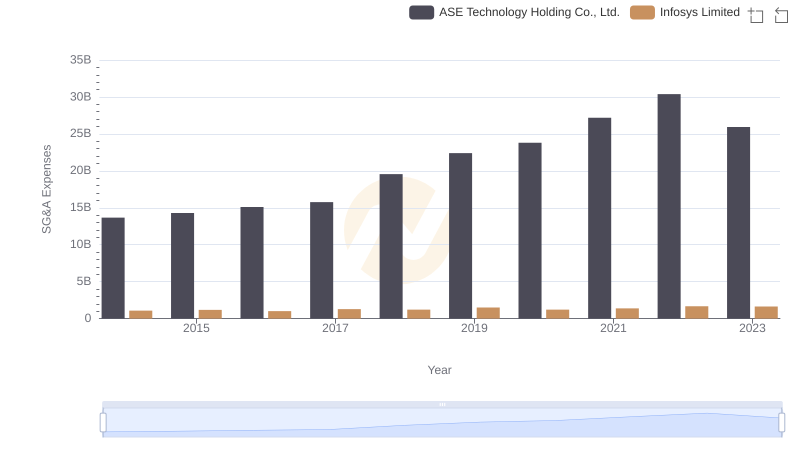
Selling, General, and Administrative Costs: Infosys Limited vs ASE Technology Holding Co., Ltd.
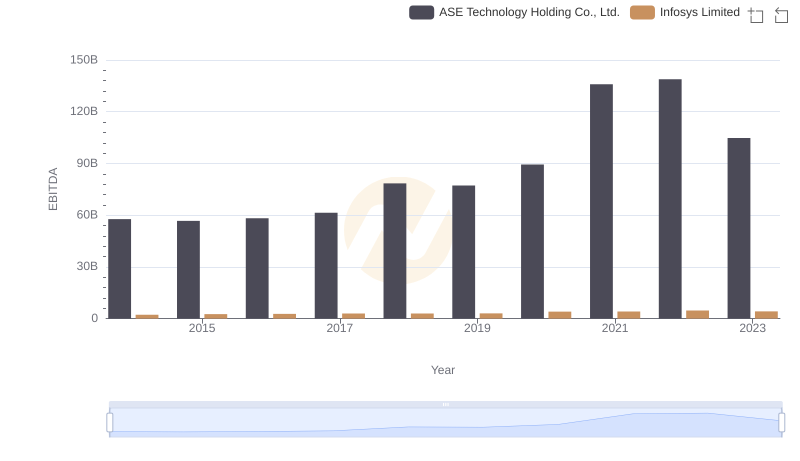
Infosys Limited and ASE Technology Holding Co., Ltd.: A Detailed Examination of EBITDA Performance