| __timestamp | ASE Technology Holding Co., Ltd. | Infosys Limited |
|---|---|---|
| Wednesday, January 1, 2014 | 53540000000 | 3337000000 |
| Thursday, January 1, 2015 | 50149000000 | 3551000000 |
| Friday, January 1, 2016 | 53194000000 | 3762000000 |
| Sunday, January 1, 2017 | 52732000000 | 3938000000 |
| Monday, January 1, 2018 | 61163000000 | 4112000000 |
| Tuesday, January 1, 2019 | 64311000000 | 4228000000 |
| Wednesday, January 1, 2020 | 77984000000 | 4733000000 |
| Friday, January 1, 2021 | 110369000000 | 5315000000 |
| Saturday, January 1, 2022 | 134930000000 | 5503000000 |
| Sunday, January 1, 2023 | 91757132000 | 5466000000 |
| Monday, January 1, 2024 | 95687183000 |
Unleashing the power of data
In the ever-evolving landscape of global technology, Infosys Limited and ASE Technology Holding Co., Ltd. stand as titans in their respective domains. Over the past decade, from 2014 to 2023, these companies have showcased remarkable growth in gross profit, albeit at different scales.
Infosys, a leader in IT services, has seen its gross profit grow by approximately 64% over this period. Starting at around $3.3 billion in 2014, it reached nearly $5.5 billion by 2023. This steady growth reflects Infosys's strategic expansion and innovation in digital services.
Meanwhile, ASE Technology, a semiconductor powerhouse, experienced a staggering 150% increase in gross profit. From $53 billion in 2014, it soared to $135 billion in 2022, before a slight dip in 2023. This surge underscores the booming demand for semiconductors globally.
Both companies exemplify resilience and adaptability, navigating challenges and capitalizing on opportunities in their industries.
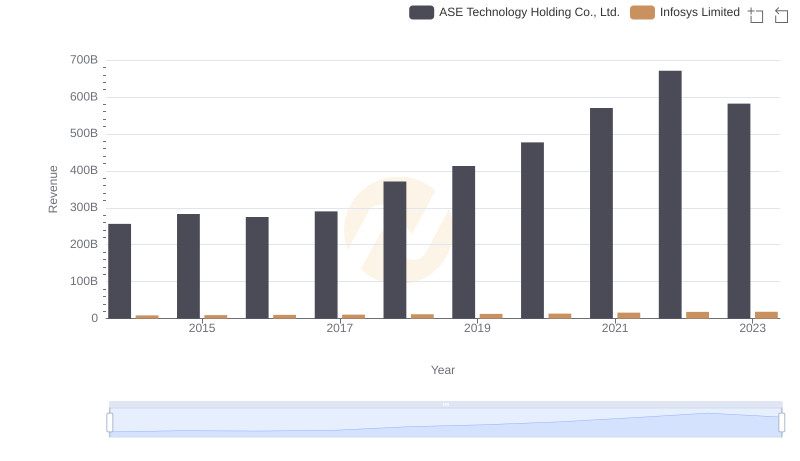
Comparing Revenue Performance: Infosys Limited or ASE Technology Holding Co., Ltd.?
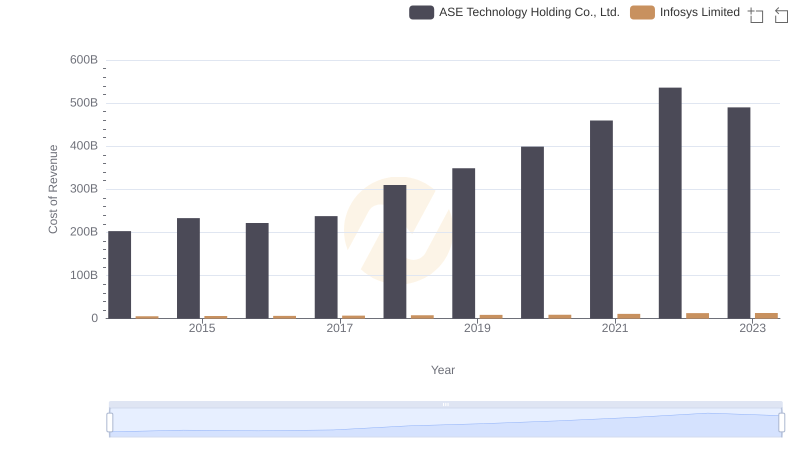
Cost of Revenue: Key Insights for Infosys Limited and ASE Technology Holding Co., Ltd.
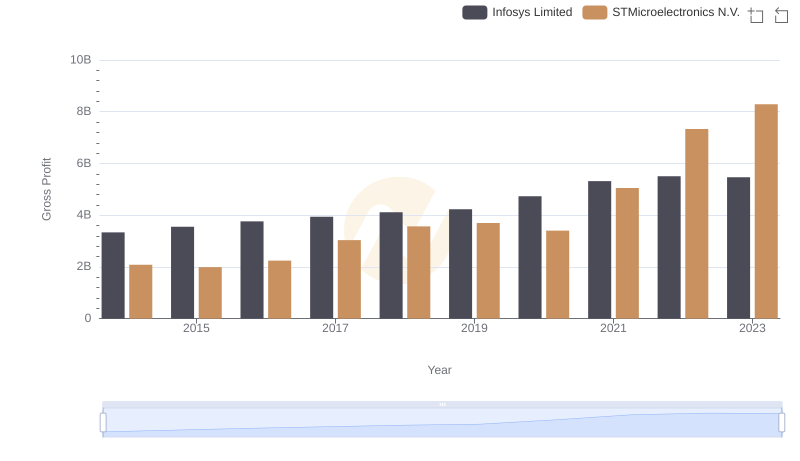
Infosys Limited and STMicroelectronics N.V.: A Detailed Gross Profit Analysis
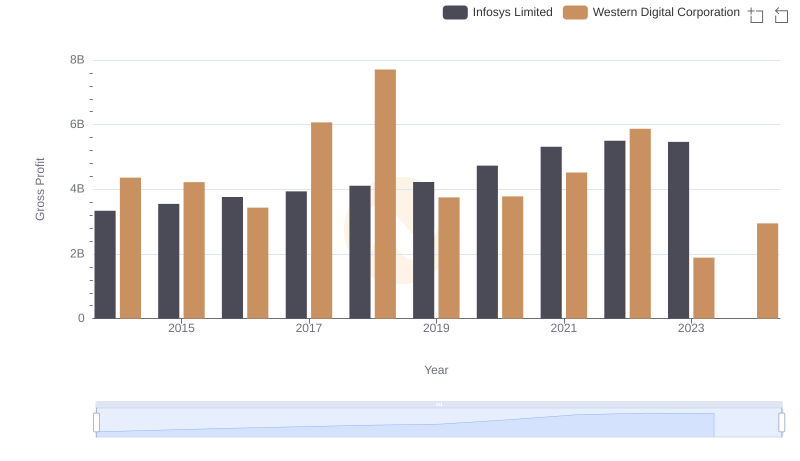
Infosys Limited and Western Digital Corporation: A Detailed Gross Profit Analysis
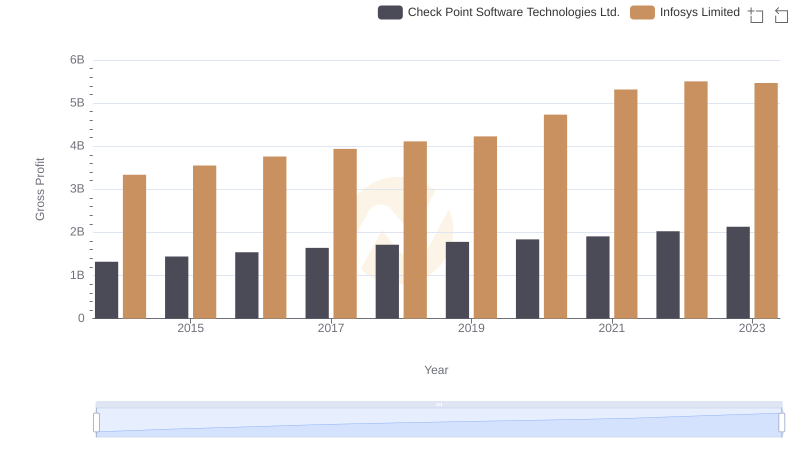
Infosys Limited vs Check Point Software Technologies Ltd.: A Gross Profit Performance Breakdown
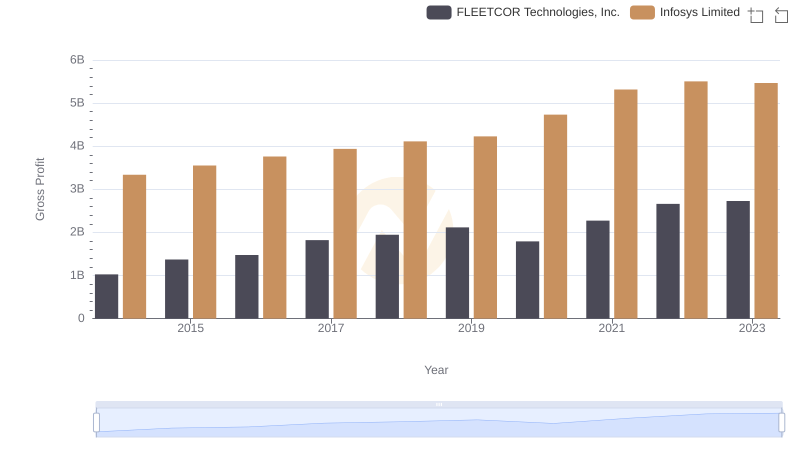
Infosys Limited and FLEETCOR Technologies, Inc.: A Detailed Gross Profit Analysis
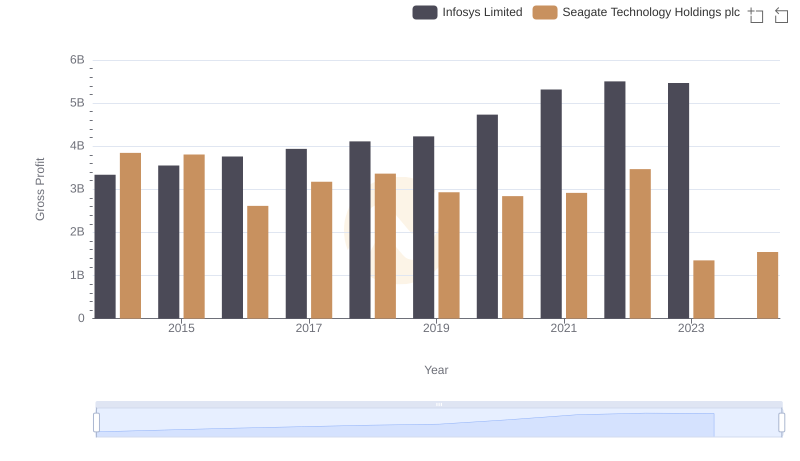
Gross Profit Comparison: Infosys Limited and Seagate Technology Holdings plc Trends
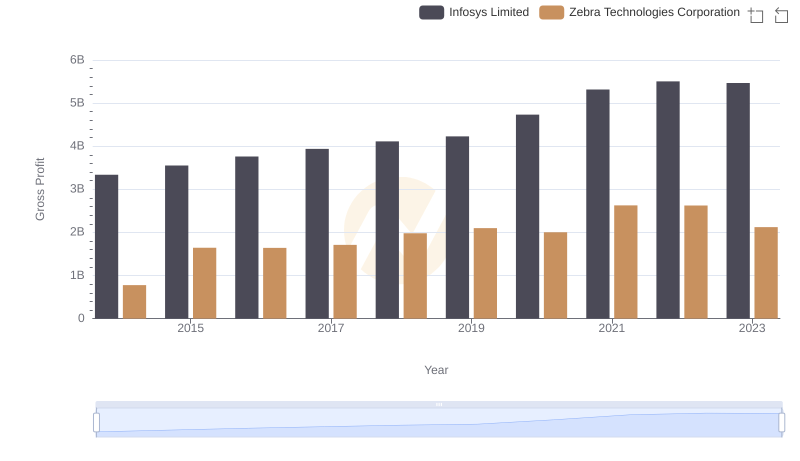
Infosys Limited vs Zebra Technologies Corporation: A Gross Profit Performance Breakdown
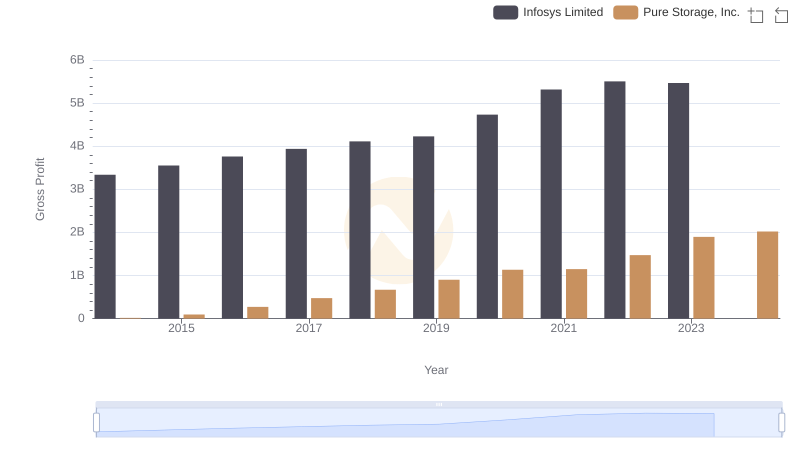
Infosys Limited and Pure Storage, Inc.: A Detailed Gross Profit Analysis
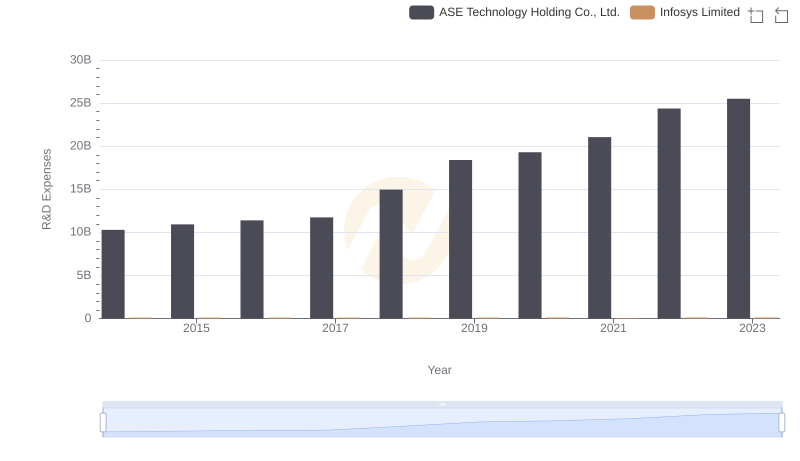
Research and Development: Comparing Key Metrics for Infosys Limited and ASE Technology Holding Co., Ltd.
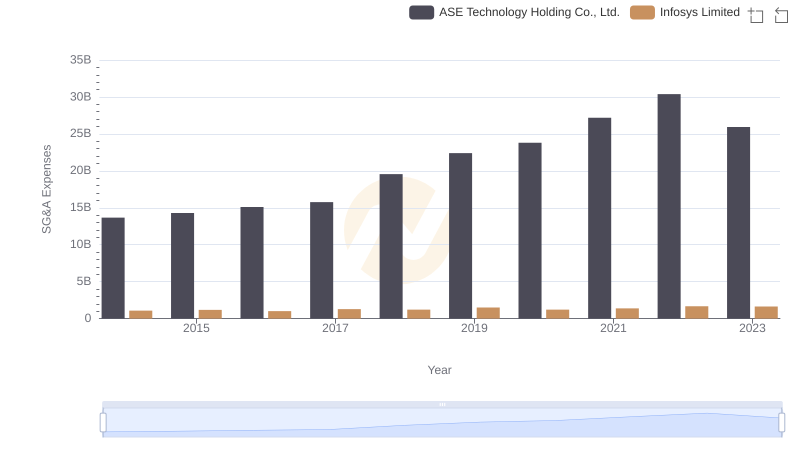
Selling, General, and Administrative Costs: Infosys Limited vs ASE Technology Holding Co., Ltd.
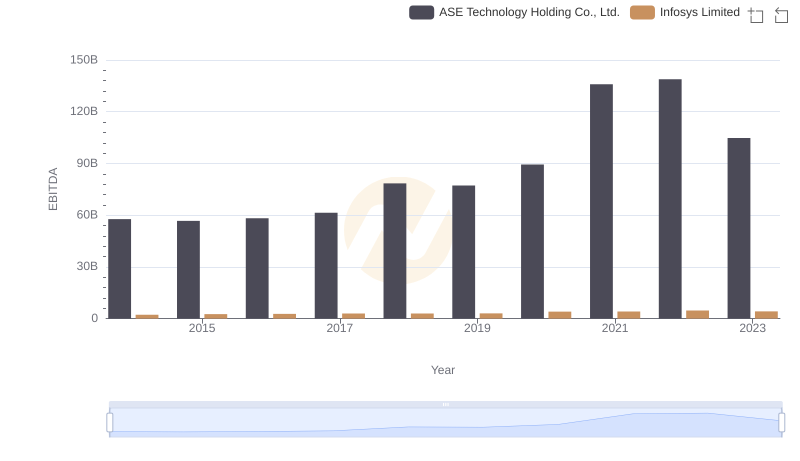
Infosys Limited and ASE Technology Holding Co., Ltd.: A Detailed Examination of EBITDA Performance