| __timestamp | AMETEK, Inc. | Waste Management, Inc. |
|---|---|---|
| Wednesday, January 1, 2014 | 1424947000 | 4994000000 |
| Thursday, January 1, 2015 | 1425015000 | 4730000000 |
| Friday, January 1, 2016 | 1264867000 | 5123000000 |
| Sunday, January 1, 2017 | 1448739000 | 5464000000 |
| Monday, January 1, 2018 | 1659562000 | 5665000000 |
| Tuesday, January 1, 2019 | 1787660000 | 5959000000 |
| Wednesday, January 1, 2020 | 1543514000 | 5877000000 |
| Friday, January 1, 2021 | 1912614000 | 6820000000 |
| Saturday, January 1, 2022 | 2145269000 | 7404000000 |
| Sunday, January 1, 2023 | 2384465001 | 7820000000 |
| Monday, January 1, 2024 | 6941180000 | 8680000000 |
Unlocking the unknown
In the ever-evolving landscape of American industry, Waste Management, Inc. and AMETEK, Inc. stand as titans in their respective fields. Over the past decade, from 2014 to 2023, these companies have demonstrated remarkable growth in gross profit, reflecting their strategic prowess and market adaptability.
Waste Management, Inc., a leader in environmental services, has seen its gross profit soar by approximately 57%, from $5 billion in 2014 to nearly $7.8 billion in 2023. This growth underscores the increasing importance of sustainable waste solutions in today's eco-conscious world.
Meanwhile, AMETEK, Inc., a global manufacturer of electronic instruments and electromechanical devices, has experienced a robust 67% increase in gross profit, rising from $1.4 billion to $2.4 billion over the same period. This surge highlights the growing demand for advanced technological solutions across various industries.
These trends not only reflect the companies' individual successes but also offer insights into broader economic shifts and consumer priorities.
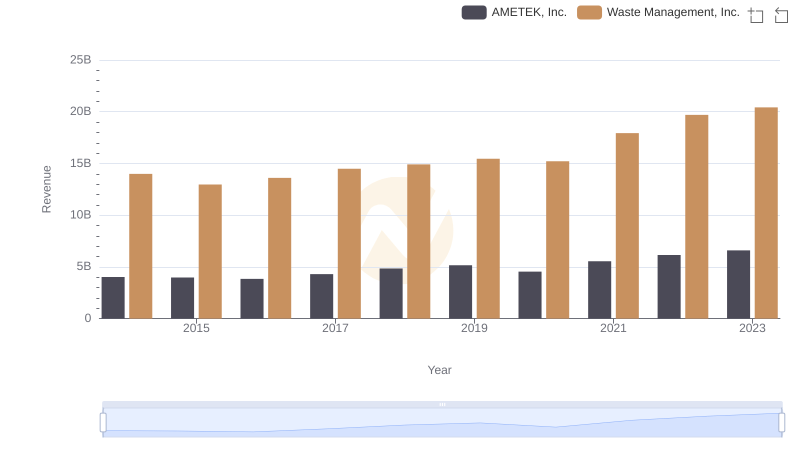
Waste Management, Inc. and AMETEK, Inc.: A Comprehensive Revenue Analysis
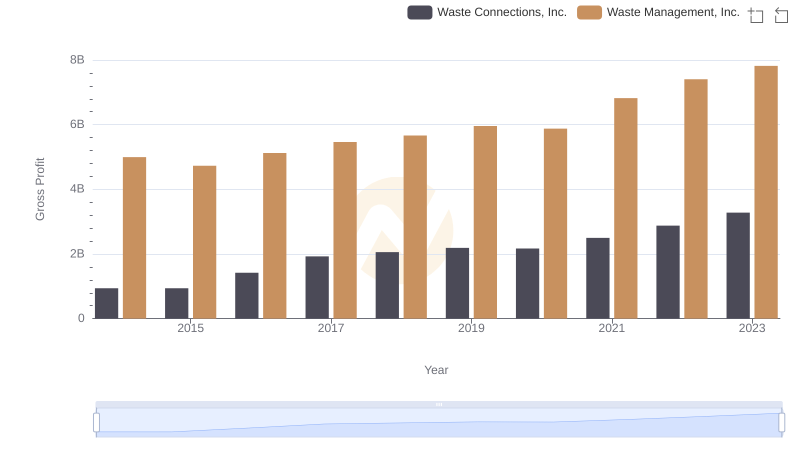
Waste Management, Inc. and Waste Connections, Inc.: A Detailed Gross Profit Analysis
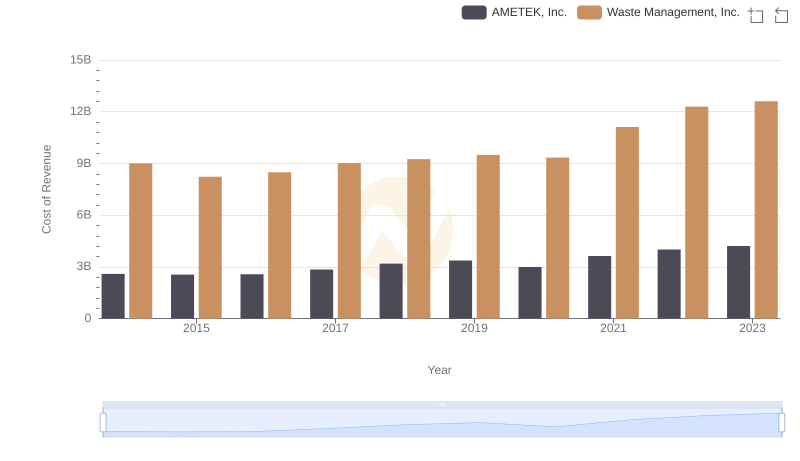
Waste Management, Inc. vs AMETEK, Inc.: Efficiency in Cost of Revenue Explored
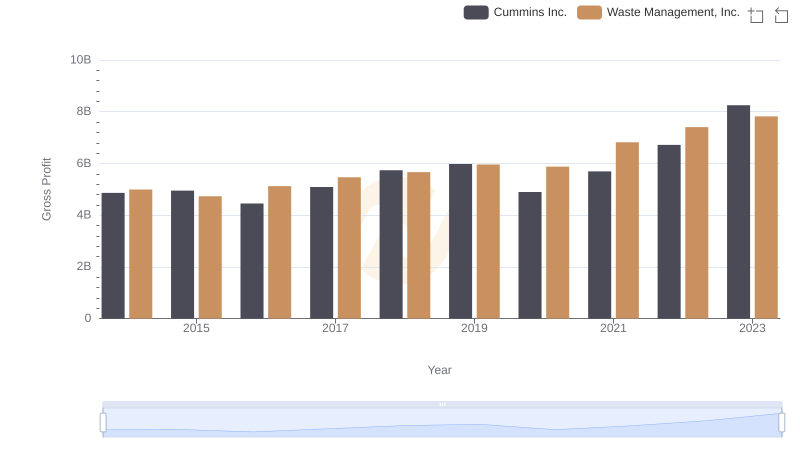
Who Generates Higher Gross Profit? Waste Management, Inc. or Cummins Inc.
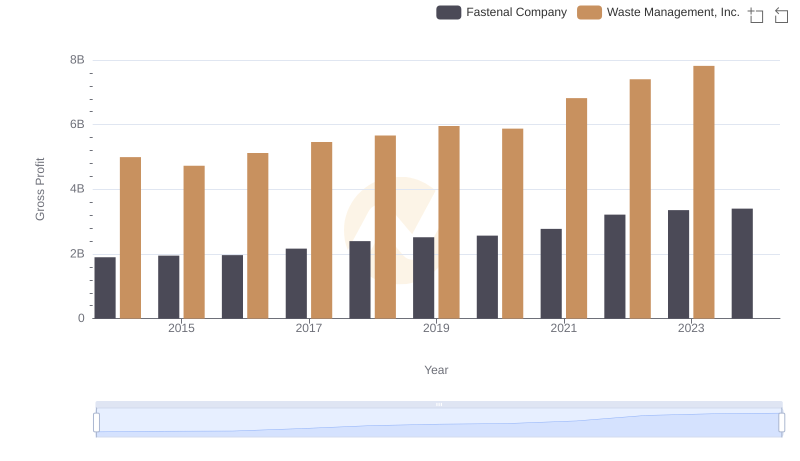
Gross Profit Trends Compared: Waste Management, Inc. vs Fastenal Company
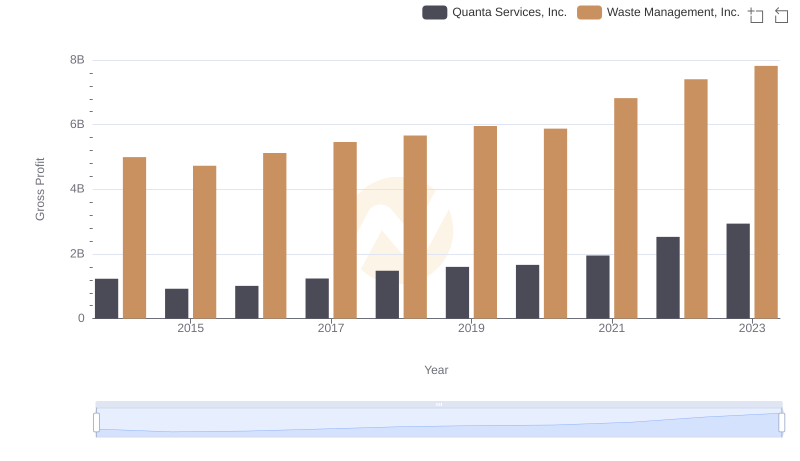
Waste Management, Inc. and Quanta Services, Inc.: A Detailed Gross Profit Analysis
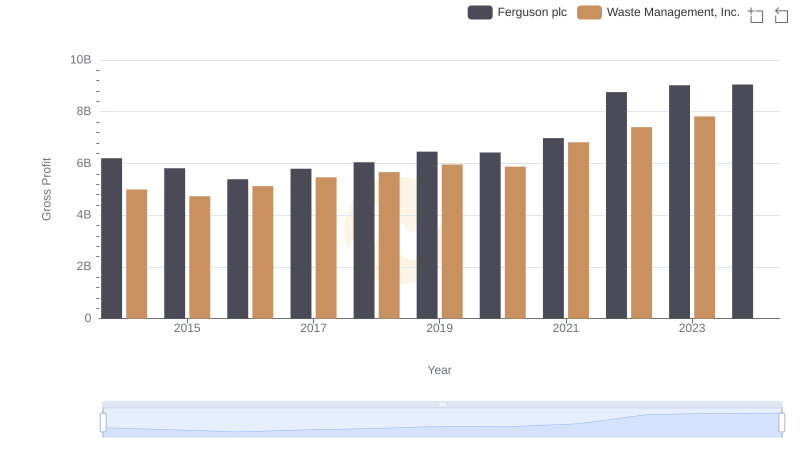
Gross Profit Trends Compared: Waste Management, Inc. vs Ferguson plc
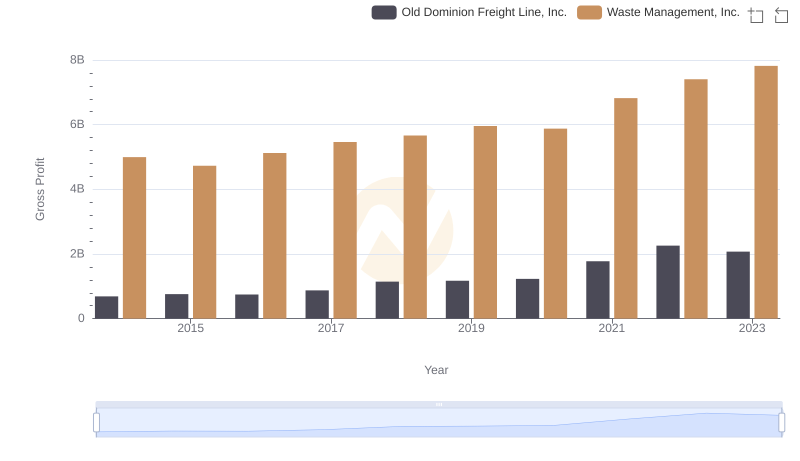
Who Generates Higher Gross Profit? Waste Management, Inc. or Old Dominion Freight Line, Inc.
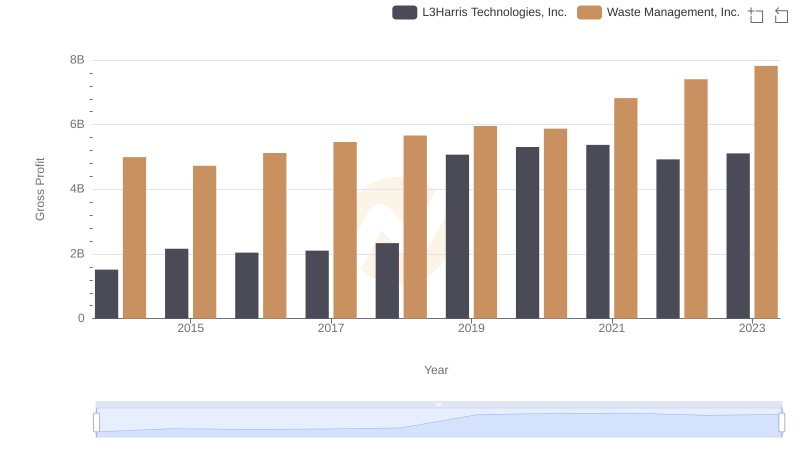
Who Generates Higher Gross Profit? Waste Management, Inc. or L3Harris Technologies, Inc.
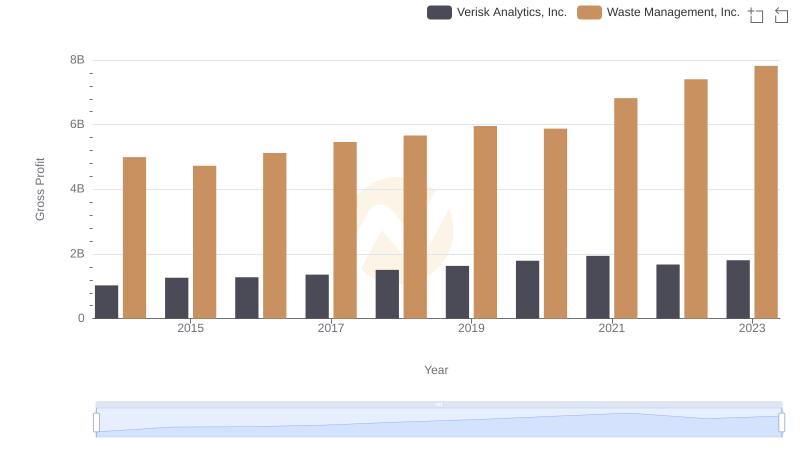
Key Insights on Gross Profit: Waste Management, Inc. vs Verisk Analytics, Inc.
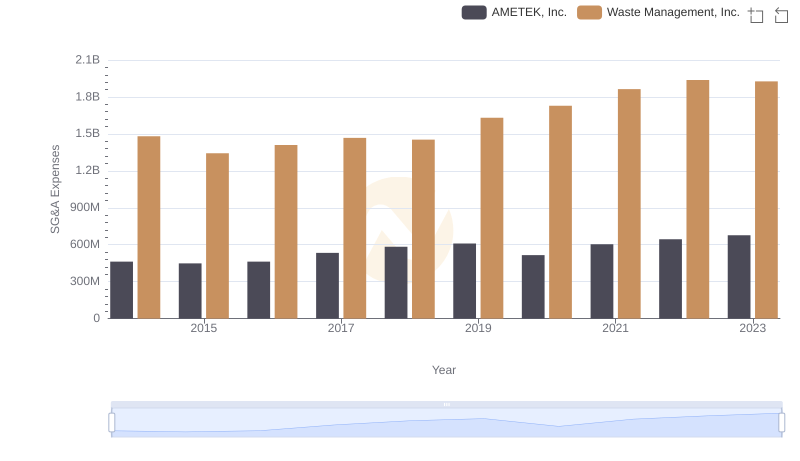
SG&A Efficiency Analysis: Comparing Waste Management, Inc. and AMETEK, Inc.
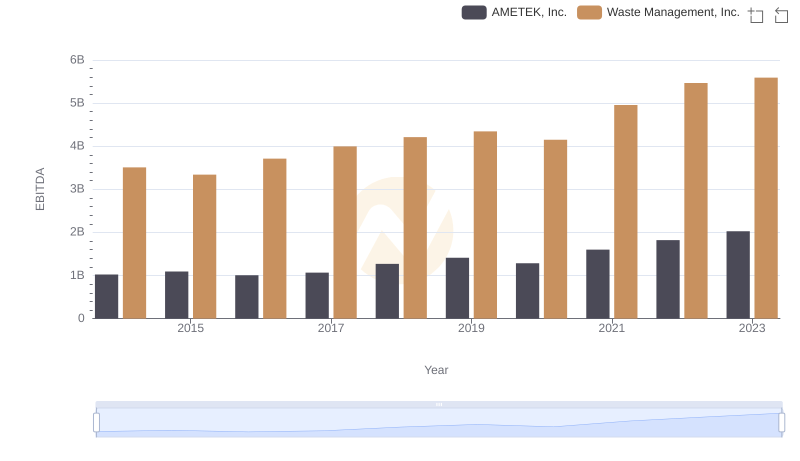
Comprehensive EBITDA Comparison: Waste Management, Inc. vs AMETEK, Inc.