| __timestamp | Ferguson plc | Waste Management, Inc. |
|---|---|---|
| Wednesday, January 1, 2014 | 6203188666 | 4994000000 |
| Thursday, January 1, 2015 | 5816457079 | 4730000000 |
| Friday, January 1, 2016 | 5389727937 | 5123000000 |
| Sunday, January 1, 2017 | 5793596551 | 5464000000 |
| Monday, January 1, 2018 | 6044000000 | 5665000000 |
| Tuesday, January 1, 2019 | 6458000000 | 5959000000 |
| Wednesday, January 1, 2020 | 6421000000 | 5877000000 |
| Friday, January 1, 2021 | 6980000000 | 6820000000 |
| Saturday, January 1, 2022 | 8756000000 | 7404000000 |
| Sunday, January 1, 2023 | 9025000000 | 7820000000 |
| Monday, January 1, 2024 | 9053000000 | 8680000000 |
Igniting the spark of knowledge
In the ever-evolving landscape of global business, Waste Management, Inc. and Ferguson plc stand as titans in their respective industries. Over the past decade, these companies have showcased remarkable growth in gross profit, reflecting their strategic prowess and market adaptability.
From 2014 to 2023, Ferguson plc's gross profit surged by approximately 46%, highlighting its robust expansion and operational efficiency. Meanwhile, Waste Management, Inc. demonstrated a commendable 57% increase, underscoring its dominance in the waste management sector. Notably, 2023 marked a peak year for both companies, with Ferguson plc reaching a gross profit of $9.03 billion and Waste Management, Inc. achieving $7.82 billion.
While the data for 2024 remains incomplete, the trends suggest a continued upward trajectory for these industry leaders. As they navigate the challenges of a dynamic market, their financial performance remains a testament to their enduring success.
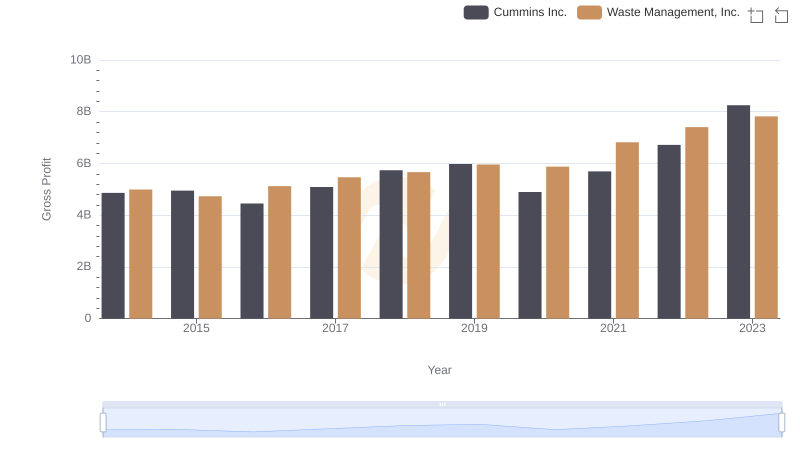
Who Generates Higher Gross Profit? Waste Management, Inc. or Cummins Inc.
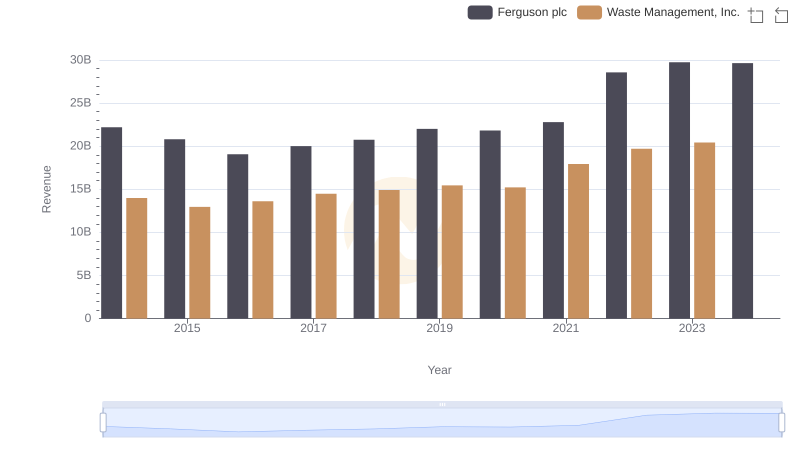
Revenue Insights: Waste Management, Inc. and Ferguson plc Performance Compared
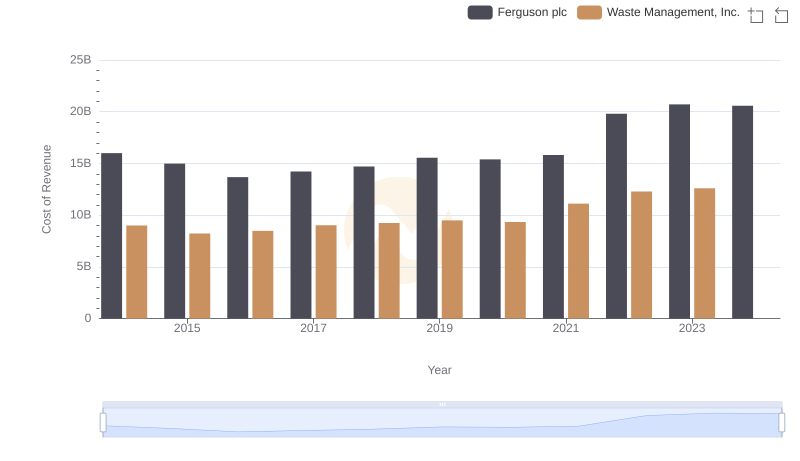
Cost of Revenue: Key Insights for Waste Management, Inc. and Ferguson plc
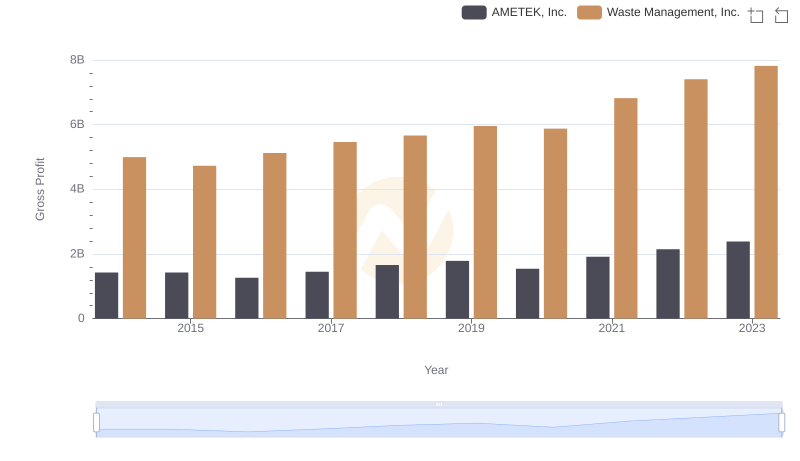
Waste Management, Inc. and AMETEK, Inc.: A Detailed Gross Profit Analysis
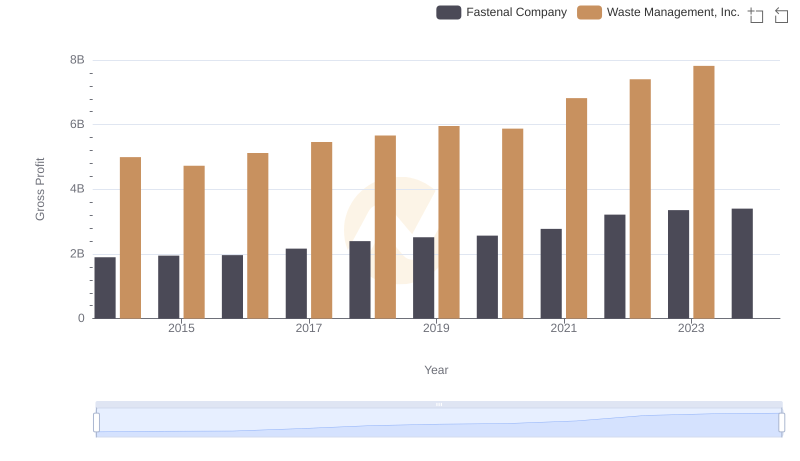
Gross Profit Trends Compared: Waste Management, Inc. vs Fastenal Company
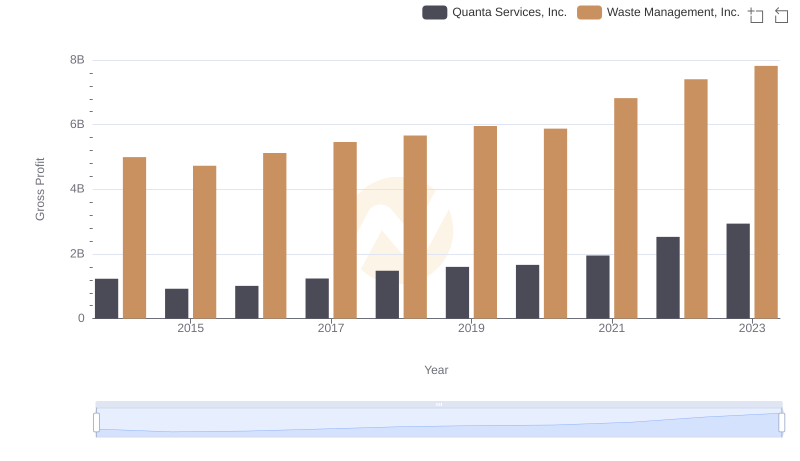
Waste Management, Inc. and Quanta Services, Inc.: A Detailed Gross Profit Analysis
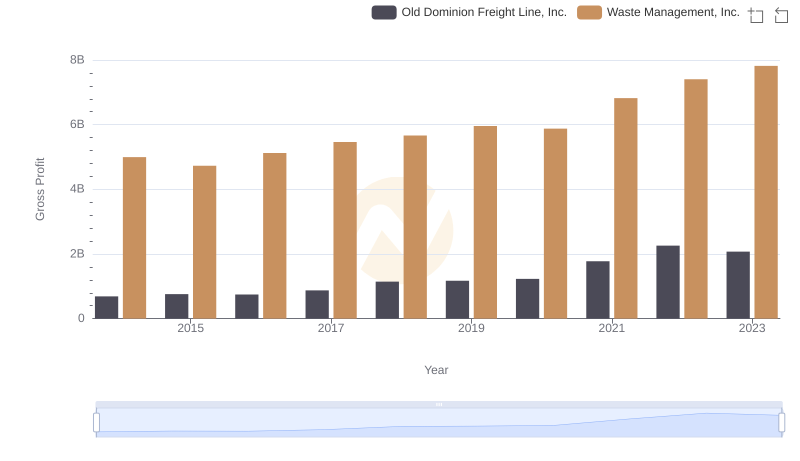
Who Generates Higher Gross Profit? Waste Management, Inc. or Old Dominion Freight Line, Inc.
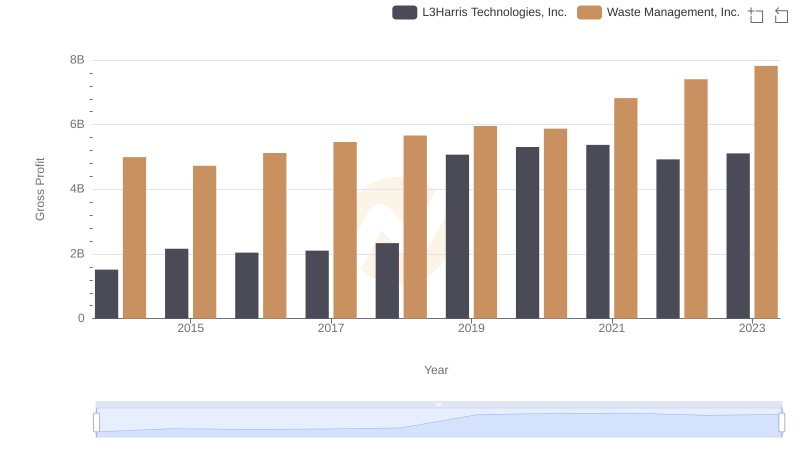
Who Generates Higher Gross Profit? Waste Management, Inc. or L3Harris Technologies, Inc.
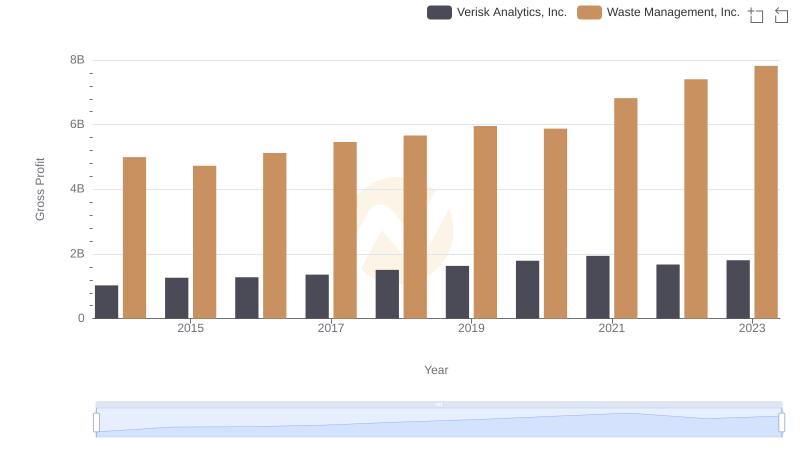
Key Insights on Gross Profit: Waste Management, Inc. vs Verisk Analytics, Inc.
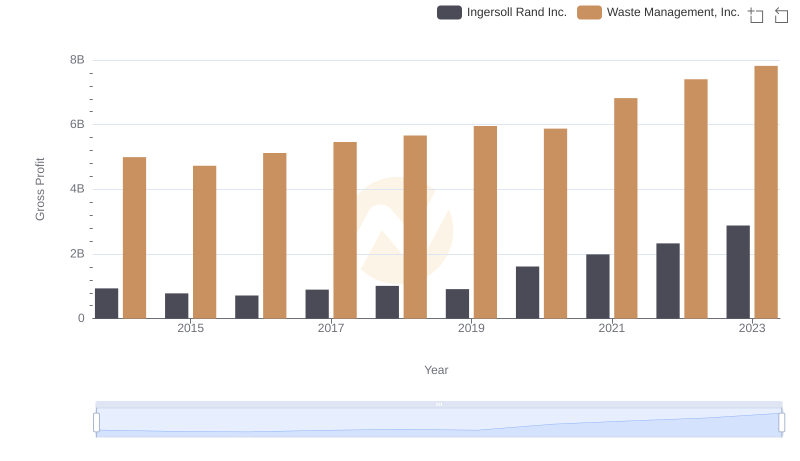
Key Insights on Gross Profit: Waste Management, Inc. vs Ingersoll Rand Inc.
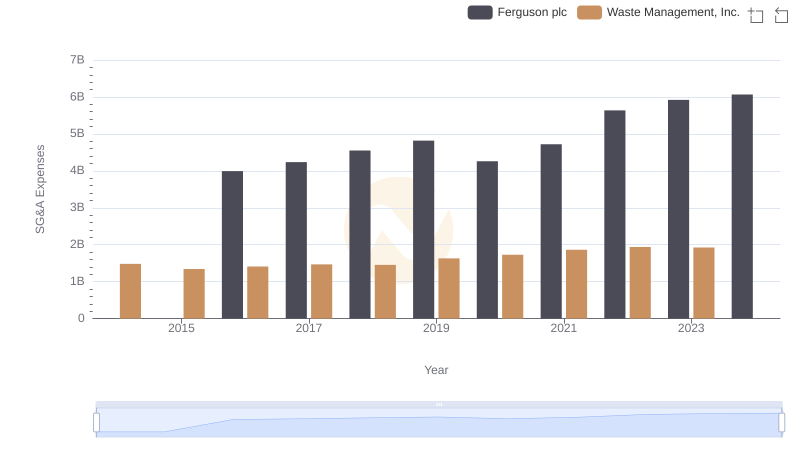
Breaking Down SG&A Expenses: Waste Management, Inc. vs Ferguson plc
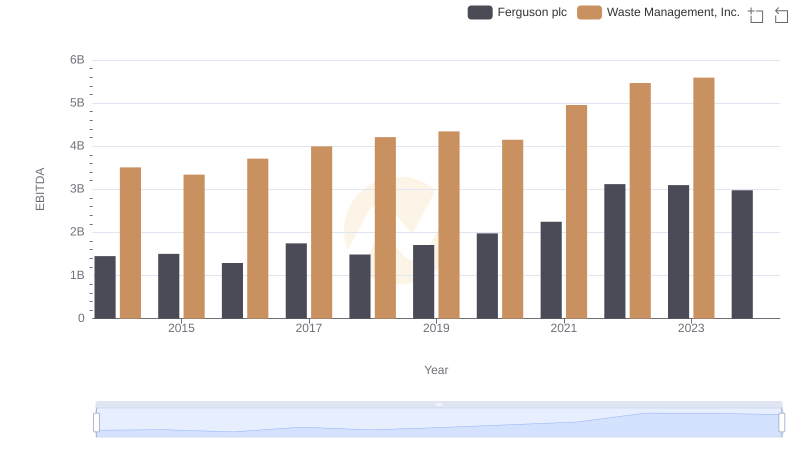
Waste Management, Inc. and Ferguson plc: A Detailed Examination of EBITDA Performance