| __timestamp | Verisk Analytics, Inc. | Waste Management, Inc. |
|---|---|---|
| Wednesday, January 1, 2014 | 1030128000 | 4994000000 |
| Thursday, January 1, 2015 | 1264736000 | 4730000000 |
| Friday, January 1, 2016 | 1280800000 | 5123000000 |
| Sunday, January 1, 2017 | 1361400000 | 5464000000 |
| Monday, January 1, 2018 | 1508900000 | 5665000000 |
| Tuesday, January 1, 2019 | 1630300000 | 5959000000 |
| Wednesday, January 1, 2020 | 1790700000 | 5877000000 |
| Friday, January 1, 2021 | 1940800000 | 6820000000 |
| Saturday, January 1, 2022 | 1672400000 | 7404000000 |
| Sunday, January 1, 2023 | 1804900000 | 7820000000 |
| Monday, January 1, 2024 | 8680000000 |
Unveiling the hidden dimensions of data
In the ever-evolving landscape of corporate finance, understanding the trajectory of gross profit is crucial for investors and analysts alike. Over the past decade, Waste Management, Inc. and Verisk Analytics, Inc. have demonstrated distinct growth patterns in their gross profits. From 2014 to 2023, Waste Management, Inc. saw a robust increase of approximately 57%, peaking at $7.82 billion in 2023. This growth underscores the company's resilience and strategic prowess in the waste management sector.
Conversely, Verisk Analytics, Inc. experienced a more moderate growth of around 75% over the same period, reaching $1.80 billion in 2023. This reflects the company's steady expansion in the analytics industry, despite facing challenges in 2022. The data highlights the contrasting yet successful strategies employed by these industry leaders, offering valuable insights for stakeholders aiming to navigate the complexities of the market.
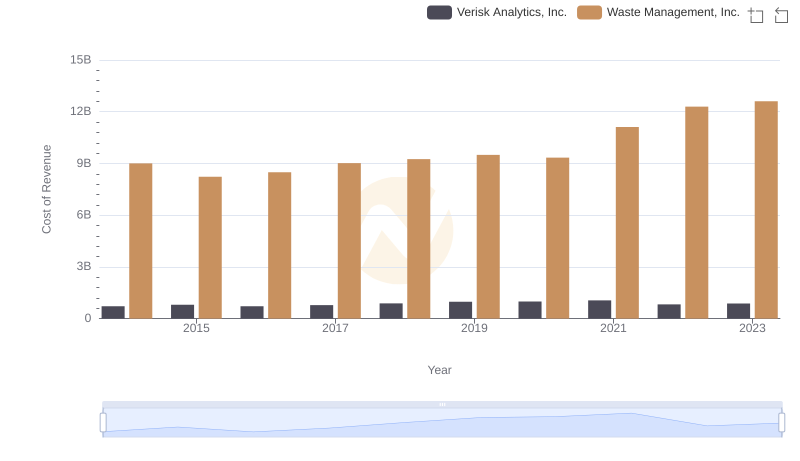
Comparing Cost of Revenue Efficiency: Waste Management, Inc. vs Verisk Analytics, Inc.
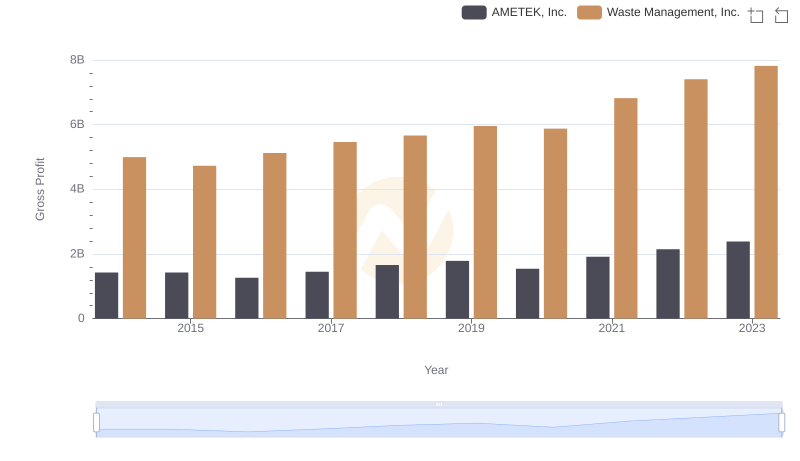
Waste Management, Inc. and AMETEK, Inc.: A Detailed Gross Profit Analysis
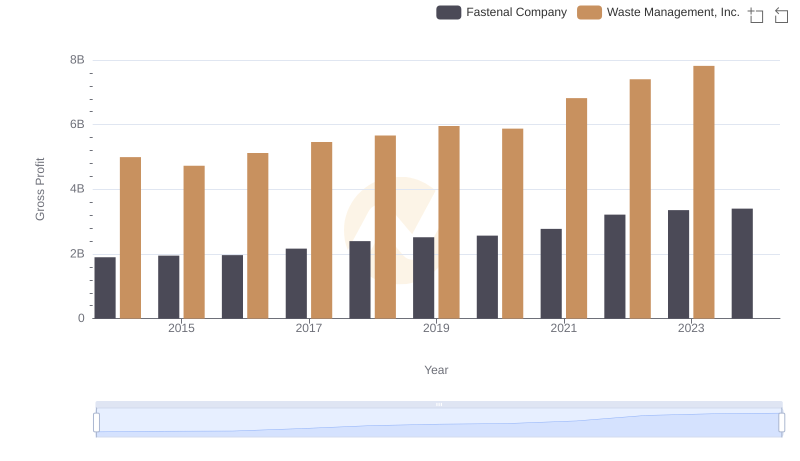
Gross Profit Trends Compared: Waste Management, Inc. vs Fastenal Company
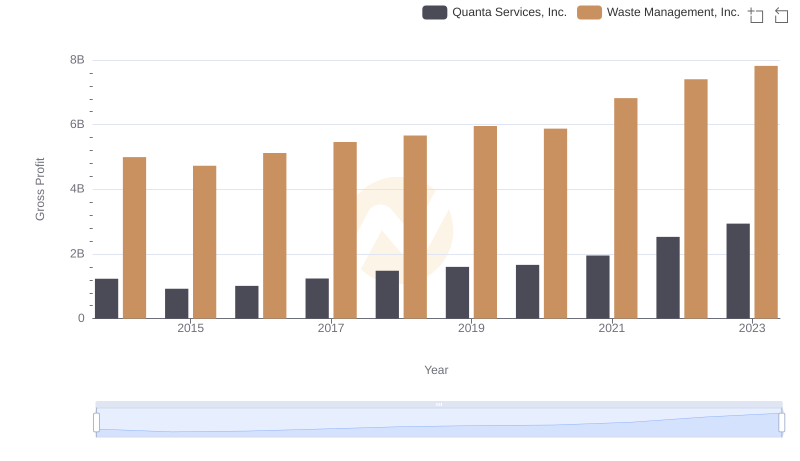
Waste Management, Inc. and Quanta Services, Inc.: A Detailed Gross Profit Analysis
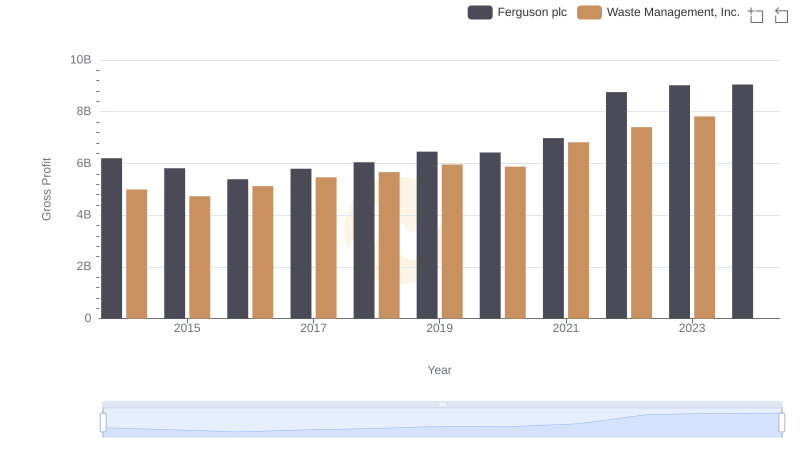
Gross Profit Trends Compared: Waste Management, Inc. vs Ferguson plc
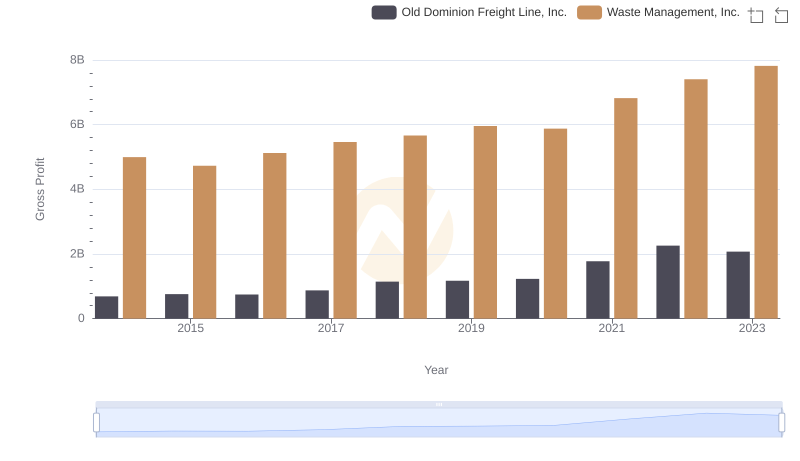
Who Generates Higher Gross Profit? Waste Management, Inc. or Old Dominion Freight Line, Inc.
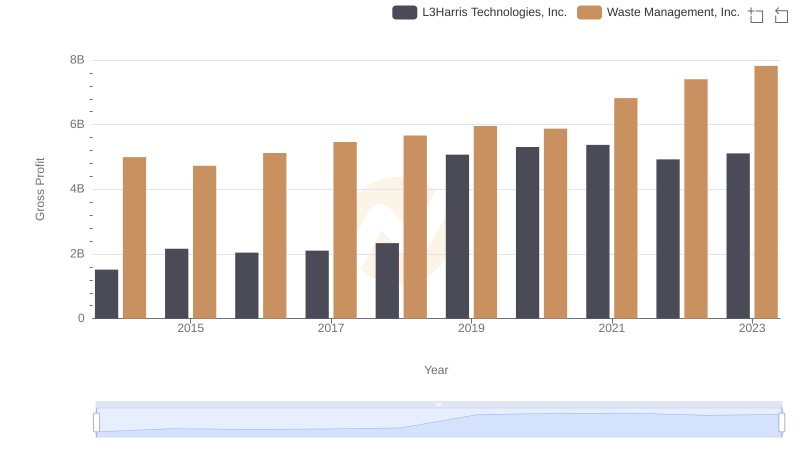
Who Generates Higher Gross Profit? Waste Management, Inc. or L3Harris Technologies, Inc.
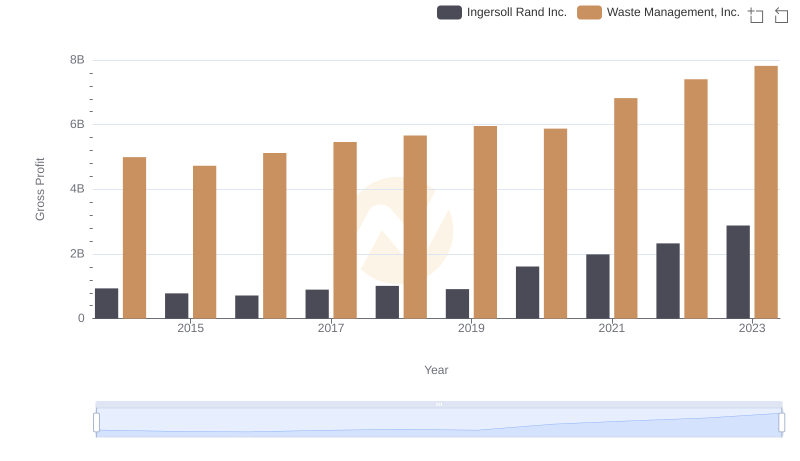
Key Insights on Gross Profit: Waste Management, Inc. vs Ingersoll Rand Inc.
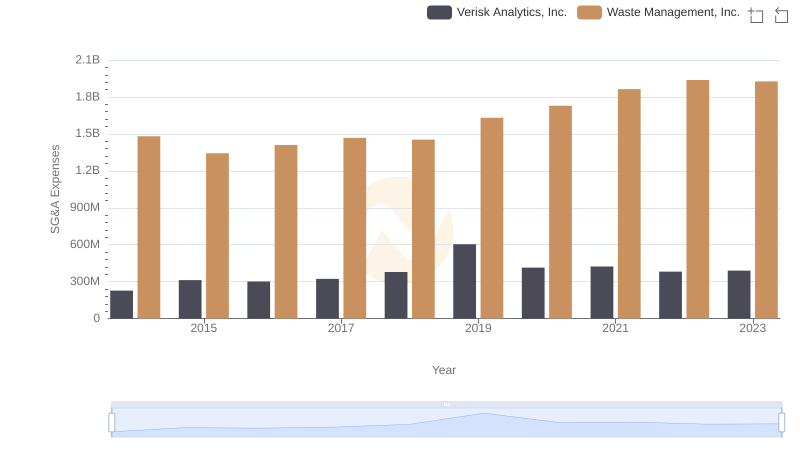
Breaking Down SG&A Expenses: Waste Management, Inc. vs Verisk Analytics, Inc.
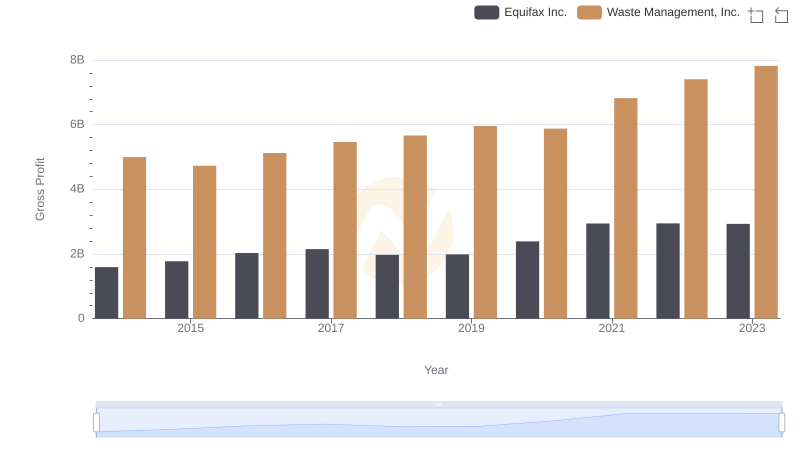
Gross Profit Trends Compared: Waste Management, Inc. vs Equifax Inc.
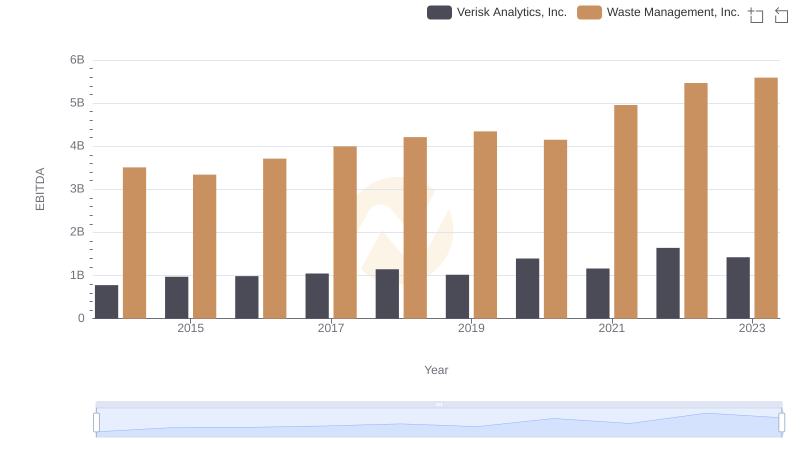
A Professional Review of EBITDA: Waste Management, Inc. Compared to Verisk Analytics, Inc.