| __timestamp | RB Global, Inc. | Waste Connections, Inc. |
|---|---|---|
| Wednesday, January 1, 2014 | 423213000 | 940778000 |
| Thursday, January 1, 2015 | 459849000 | 939878000 |
| Friday, January 1, 2016 | 500333000 | 1418151000 |
| Sunday, January 1, 2017 | 531504000 | 1925713000 |
| Monday, January 1, 2018 | 636629000 | 2057237000 |
| Tuesday, January 1, 2019 | 672825000 | 2189922000 |
| Wednesday, January 1, 2020 | 761671000 | 2169182000 |
| Friday, January 1, 2021 | 822188000 | 2497287000 |
| Saturday, January 1, 2022 | 957107000 | 2875847000 |
| Sunday, January 1, 2023 | 1778400000 | 3277438000 |
| Monday, January 1, 2024 | 4284200000 | 3727885000 |
Infusing magic into the data realm
In the ever-evolving landscape of waste management and auction services, Waste Connections, Inc. and RB Global, Inc. have emerged as industry leaders. Over the past decade, from 2014 to 2023, these companies have demonstrated remarkable growth in gross profit, reflecting their strategic prowess and market adaptability.
Waste Connections, Inc. has consistently outperformed RB Global, Inc., with a gross profit increase of approximately 248% over the period. By 2023, Waste Connections, Inc. achieved a gross profit of $3.28 billion, a testament to its robust operational strategies and market expansion. In contrast, RB Global, Inc. saw a significant surge in 2023, with a gross profit of $1.78 billion, marking a 320% increase since 2014.
This analysis underscores the dynamic nature of these industries and highlights the importance of strategic growth and innovation in maintaining competitive advantage.
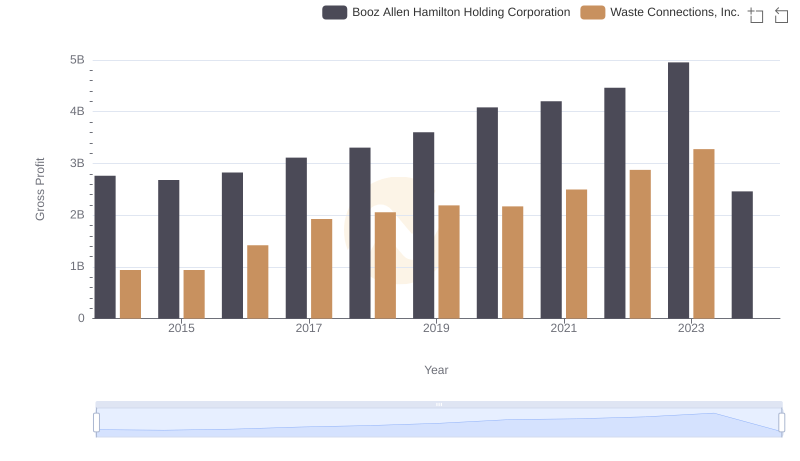
Gross Profit Comparison: Waste Connections, Inc. and Booz Allen Hamilton Holding Corporation Trends
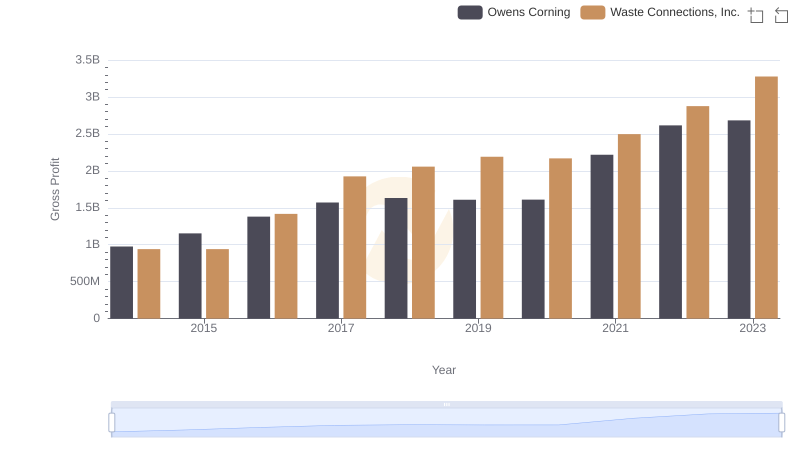
Who Generates Higher Gross Profit? Waste Connections, Inc. or Owens Corning
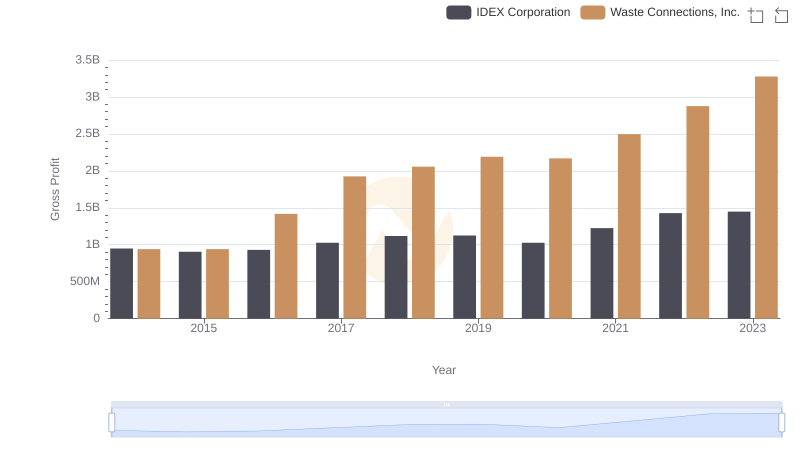
Gross Profit Comparison: Waste Connections, Inc. and IDEX Corporation Trends
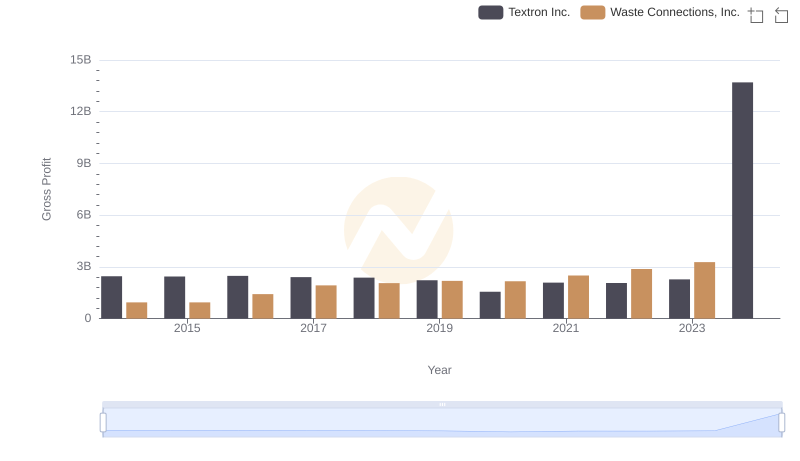
Gross Profit Comparison: Waste Connections, Inc. and Textron Inc. Trends
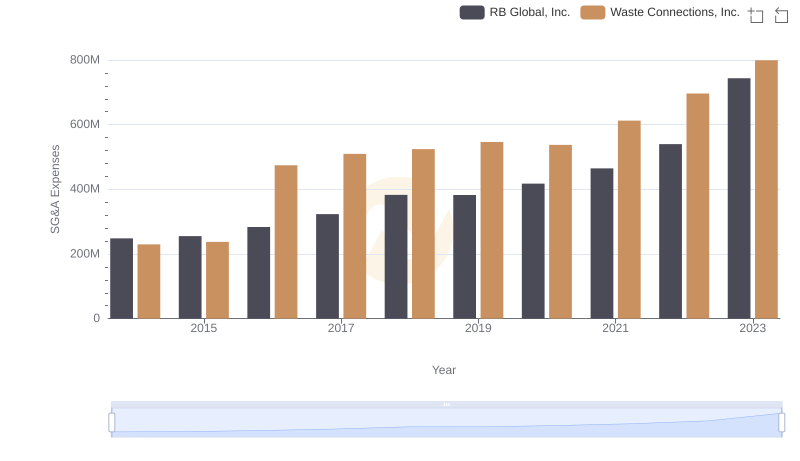
Waste Connections, Inc. vs RB Global, Inc.: SG&A Expense Trends
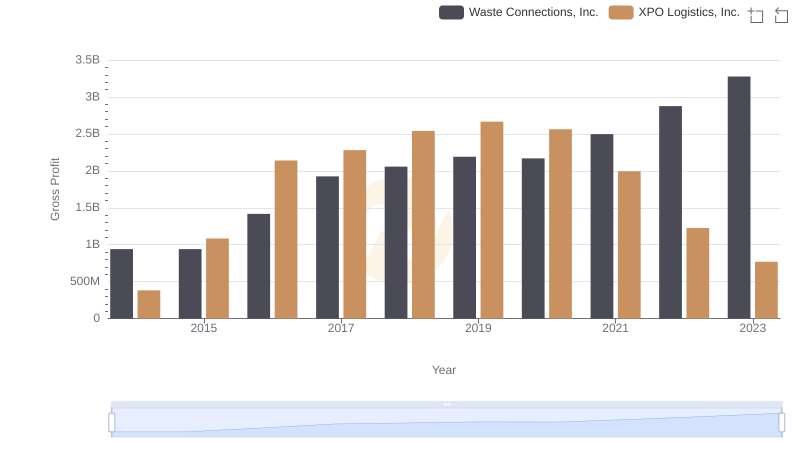
Who Generates Higher Gross Profit? Waste Connections, Inc. or XPO Logistics, Inc.
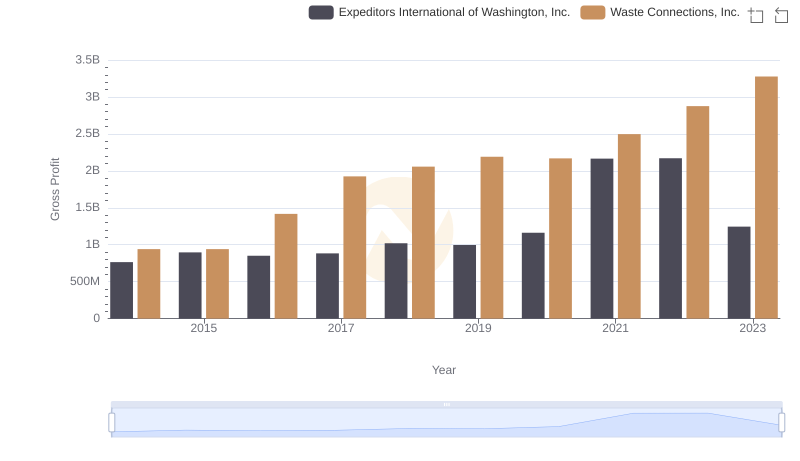
Gross Profit Trends Compared: Waste Connections, Inc. vs Expeditors International of Washington, Inc.
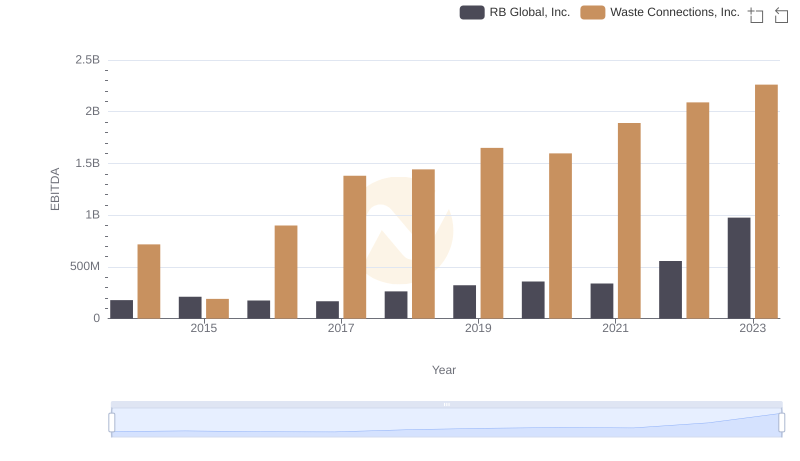
Professional EBITDA Benchmarking: Waste Connections, Inc. vs RB Global, Inc.