| __timestamp | Rockwell Automation, Inc. | XPO Logistics, Inc. |
|---|---|---|
| Wednesday, January 1, 2014 | 2753900000 | 381600000 |
| Thursday, January 1, 2015 | 2703100000 | 1084800000 |
| Friday, January 1, 2016 | 2475500000 | 2139300000 |
| Sunday, January 1, 2017 | 2624200000 | 2279700000 |
| Monday, January 1, 2018 | 2872200000 | 2541000000 |
| Tuesday, January 1, 2019 | 2900100000 | 2666000000 |
| Wednesday, January 1, 2020 | 2595200000 | 2563000000 |
| Friday, January 1, 2021 | 2897700000 | 1994000000 |
| Saturday, January 1, 2022 | 3102000000 | 1227000000 |
| Sunday, January 1, 2023 | 3717000000 | 770000000 |
| Monday, January 1, 2024 | 3193400000 | 915000000 |
Infusing magic into the data realm
In the ever-evolving landscape of industrial automation and logistics, Rockwell Automation, Inc. and XPO Logistics, Inc. have carved distinct paths. Over the past decade, Rockwell Automation has consistently demonstrated robust growth, with its gross profit peaking at an impressive $3.7 billion in 2023, marking a 35% increase from 2014. In contrast, XPO Logistics experienced a more volatile journey, with its gross profit reaching a high of $2.7 billion in 2019 before declining to $770 million in 2023. This divergence highlights the resilience of Rockwell Automation amidst market fluctuations, while XPO Logistics faces challenges in maintaining its upward trajectory. The data from 2024 remains incomplete for XPO, leaving room for speculation on its future performance. As these industry leaders navigate the complexities of their respective sectors, their financial narratives offer valuable insights into strategic adaptability and market positioning.
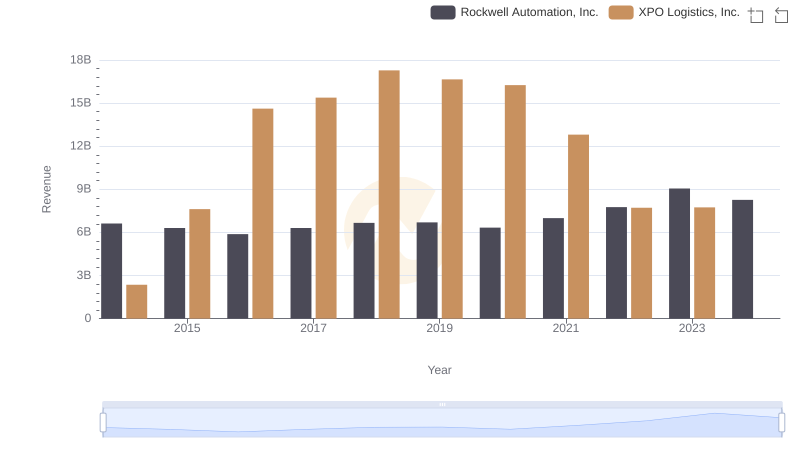
Revenue Showdown: Rockwell Automation, Inc. vs XPO Logistics, Inc.
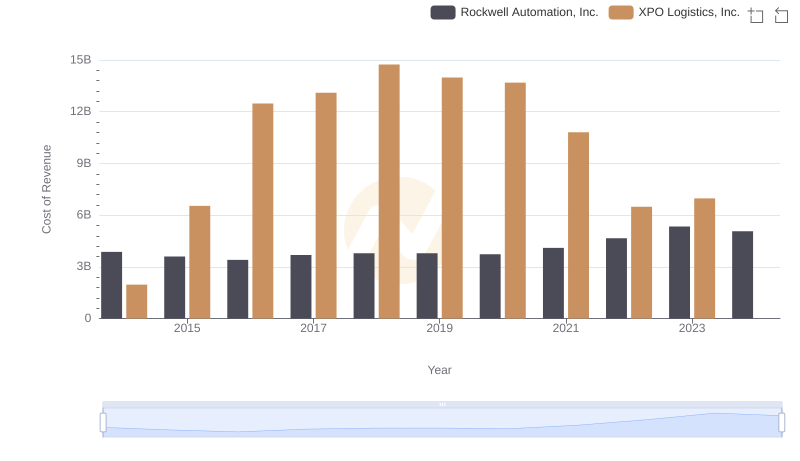
Cost of Revenue: Key Insights for Rockwell Automation, Inc. and XPO Logistics, Inc.
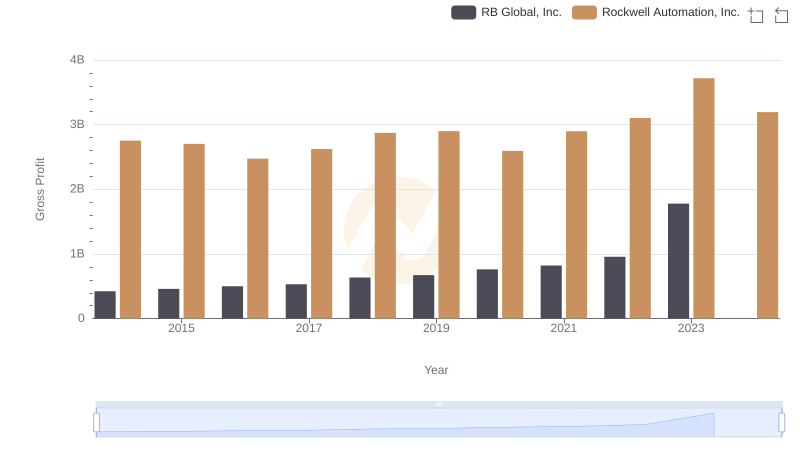
Gross Profit Trends Compared: Rockwell Automation, Inc. vs RB Global, Inc.
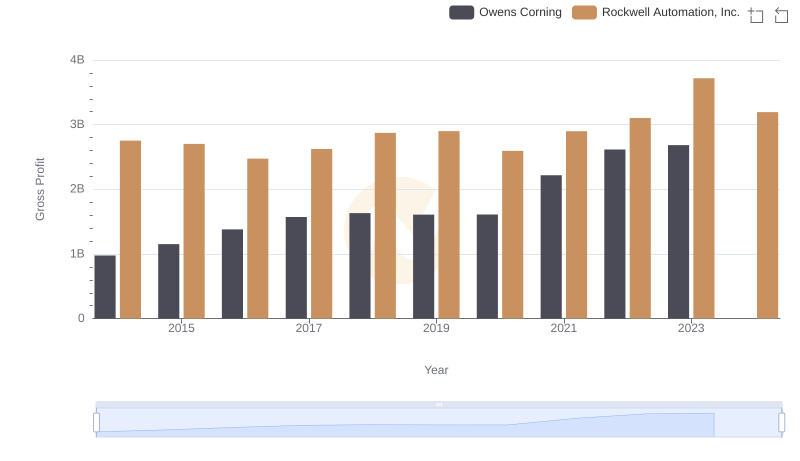
Gross Profit Trends Compared: Rockwell Automation, Inc. vs Owens Corning
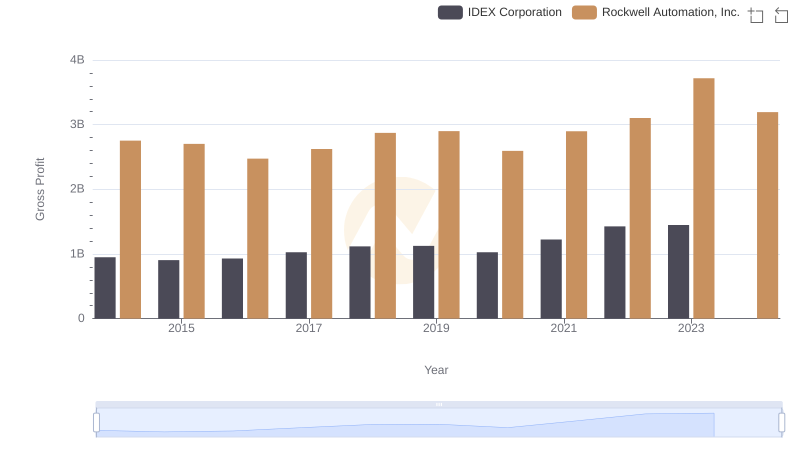
Rockwell Automation, Inc. and IDEX Corporation: A Detailed Gross Profit Analysis
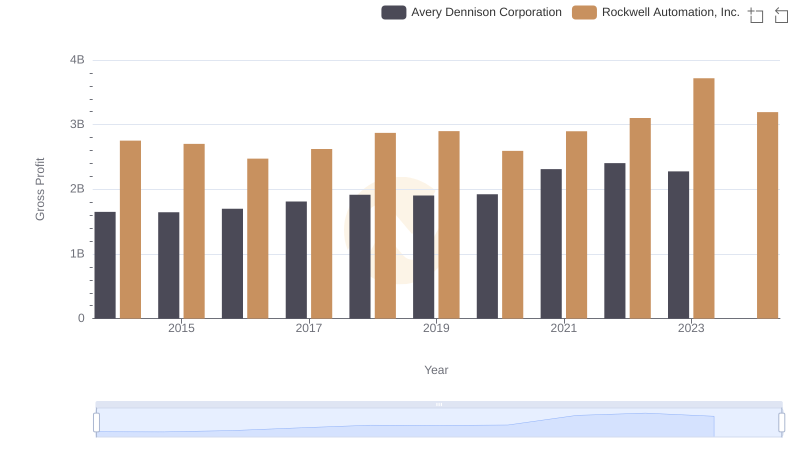
Gross Profit Trends Compared: Rockwell Automation, Inc. vs Avery Dennison Corporation

Gross Profit Comparison: Rockwell Automation, Inc. and Expeditors International of Washington, Inc. Trends
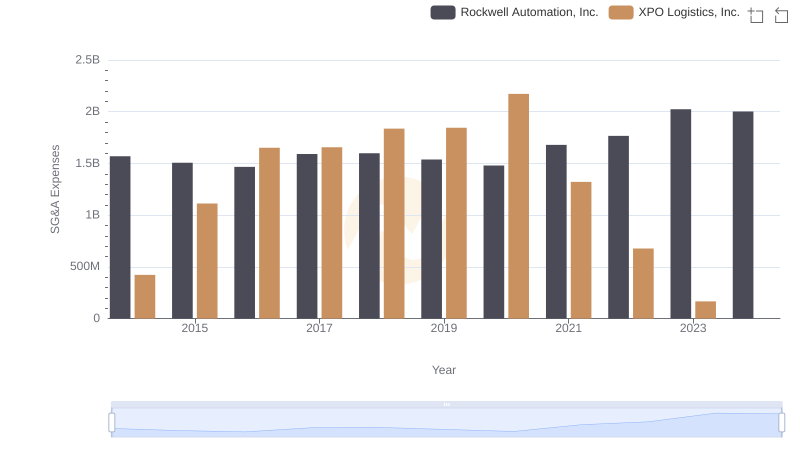
Rockwell Automation, Inc. or XPO Logistics, Inc.: Who Manages SG&A Costs Better?
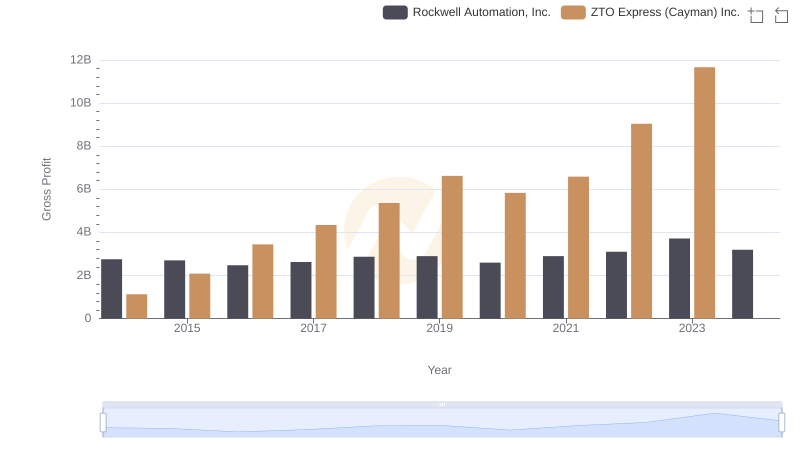
Key Insights on Gross Profit: Rockwell Automation, Inc. vs ZTO Express (Cayman) Inc.

Comprehensive EBITDA Comparison: Rockwell Automation, Inc. vs XPO Logistics, Inc.