| __timestamp | Infosys Limited | Marvell Technology, Inc. |
|---|---|---|
| Wednesday, January 1, 2014 | 3337000000 | 1750170000 |
| Thursday, January 1, 2015 | 3551000000 | 1863257000 |
| Friday, January 1, 2016 | 3762000000 | 1231092000 |
| Sunday, January 1, 2017 | 3938000000 | 1288147000 |
| Monday, January 1, 2018 | 4112000000 | 1461940000 |
| Tuesday, January 1, 2019 | 4228000000 | 1458392000 |
| Wednesday, January 1, 2020 | 4733000000 | 1356941000 |
| Friday, January 1, 2021 | 5315000000 | 1488350000 |
| Saturday, January 1, 2022 | 5503000000 | 2064225000 |
| Sunday, January 1, 2023 | 5466000000 | 2987500000 |
| Monday, January 1, 2024 | 2293600000 |
Unleashing insights
In the ever-evolving landscape of technology, Infosys Limited and Marvell Technology, Inc. have carved distinct paths. Over the past decade, Infosys has consistently demonstrated robust growth, with its gross profit surging by approximately 64% from 2014 to 2023. In contrast, Marvell Technology, Inc. has shown a more volatile trajectory, with a notable 71% increase in gross profit during the same period, peaking in 2023. This divergence highlights the dynamic nature of the tech industry, where strategic pivots and market demands shape financial outcomes. While Infosys's steady climb reflects its stronghold in IT services, Marvell's recent spike underscores its strategic focus on semiconductor solutions. As we look to the future, the missing data for 2024 invites speculation on how these giants will navigate the challenges and opportunities ahead.
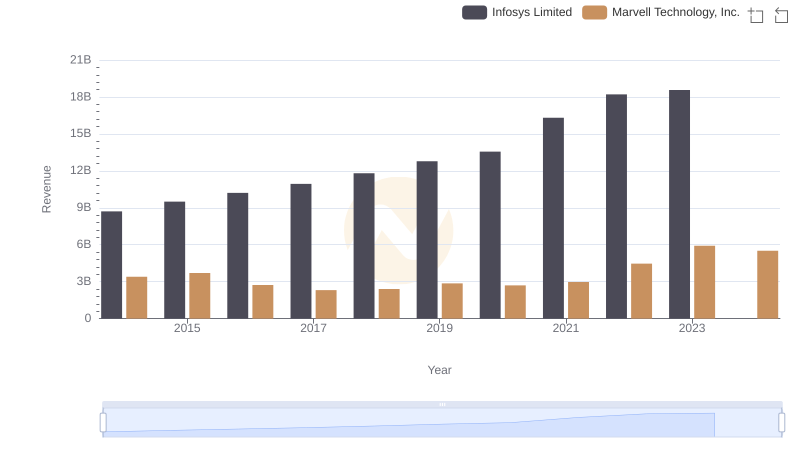
Infosys Limited and Marvell Technology, Inc.: A Comprehensive Revenue Analysis
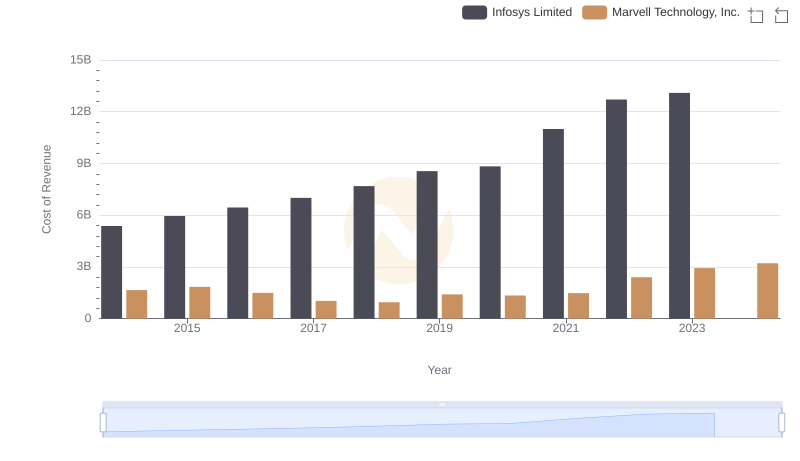
Cost of Revenue Trends: Infosys Limited vs Marvell Technology, Inc.
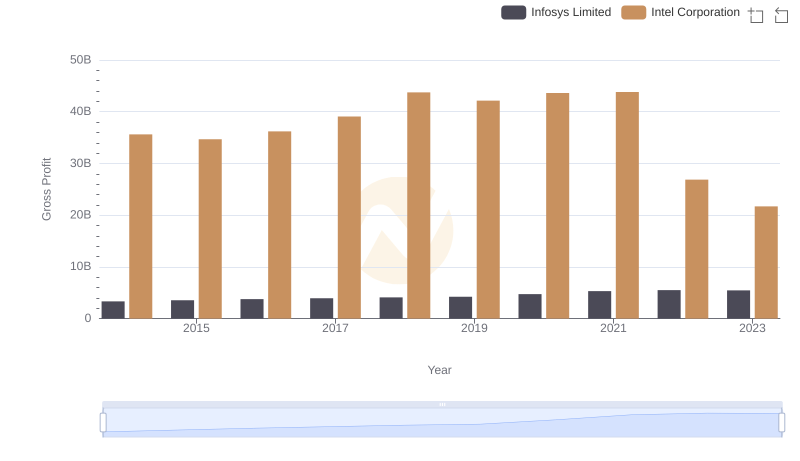
Gross Profit Analysis: Comparing Infosys Limited and Intel Corporation
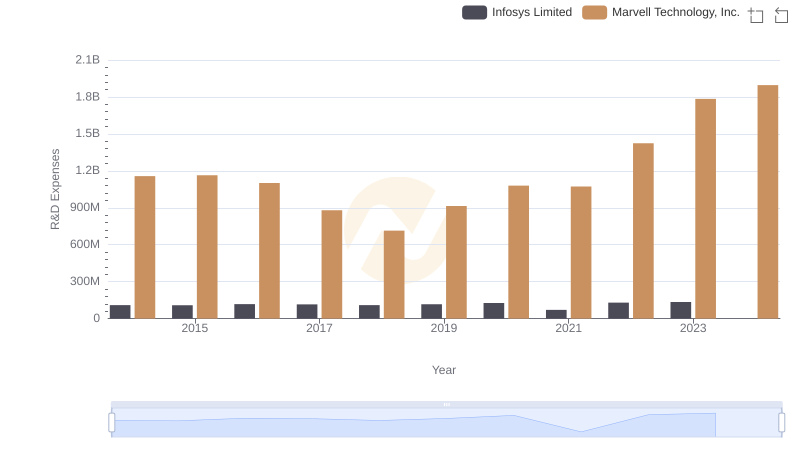
Research and Development Expenses Breakdown: Infosys Limited vs Marvell Technology, Inc.
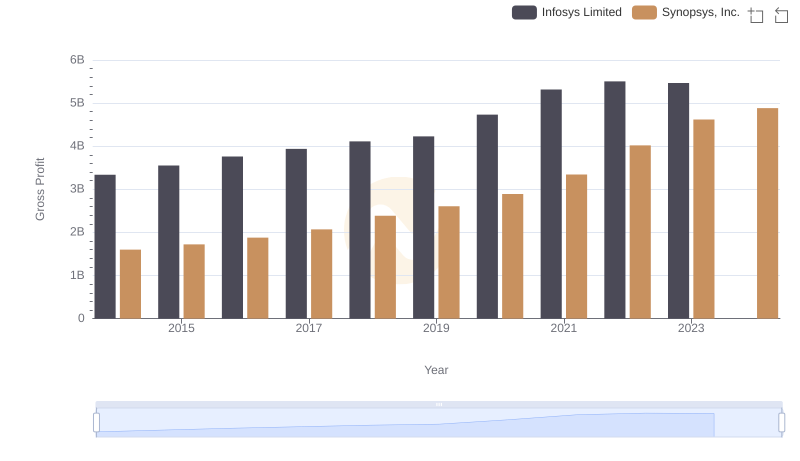
Gross Profit Analysis: Comparing Infosys Limited and Synopsys, Inc.
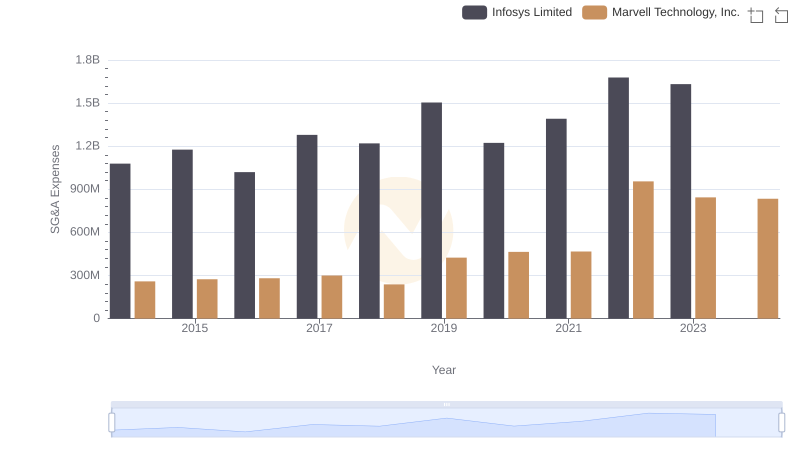
SG&A Efficiency Analysis: Comparing Infosys Limited and Marvell Technology, Inc.
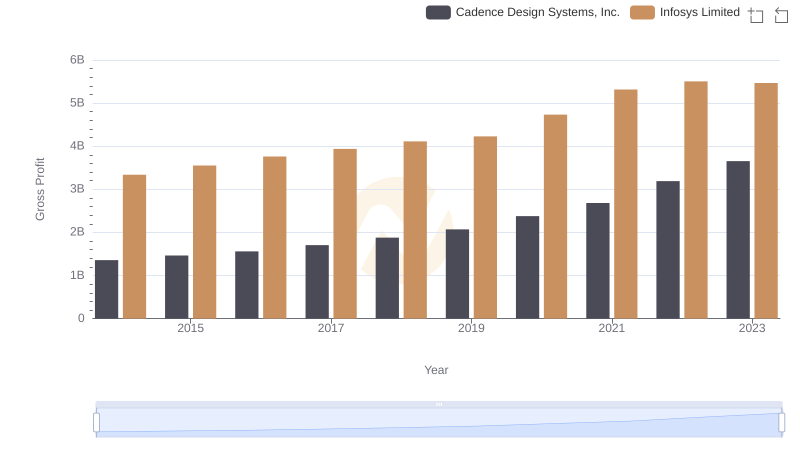
Infosys Limited and Cadence Design Systems, Inc.: A Detailed Gross Profit Analysis
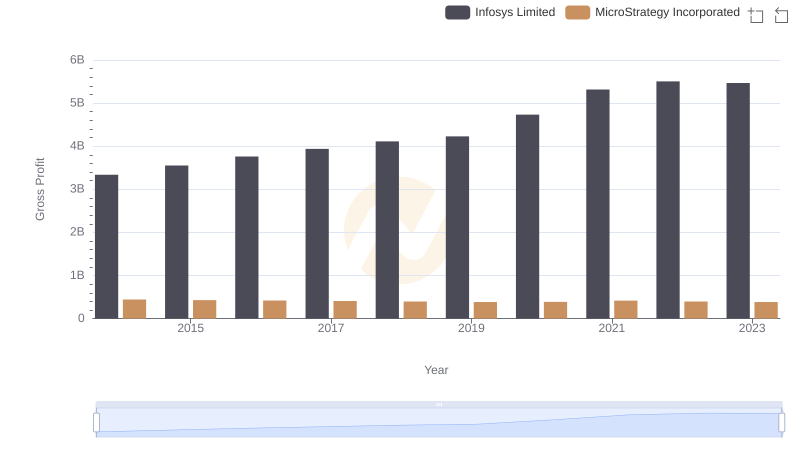
Who Generates Higher Gross Profit? Infosys Limited or MicroStrategy Incorporated
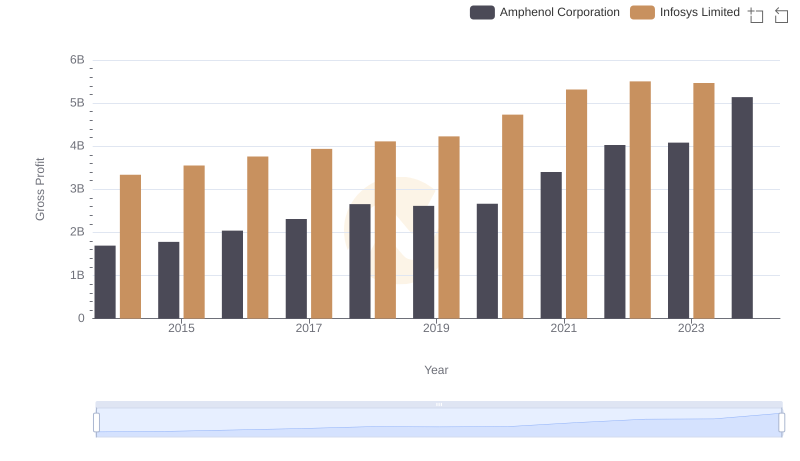
Infosys Limited vs Amphenol Corporation: A Gross Profit Performance Breakdown
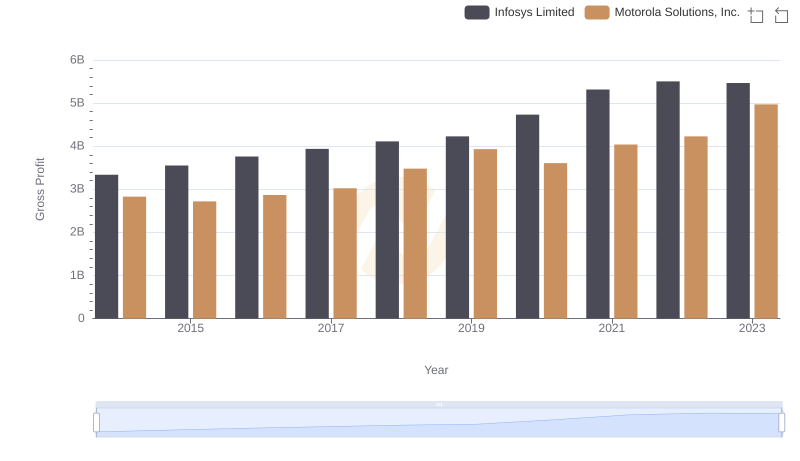
Who Generates Higher Gross Profit? Infosys Limited or Motorola Solutions, Inc.
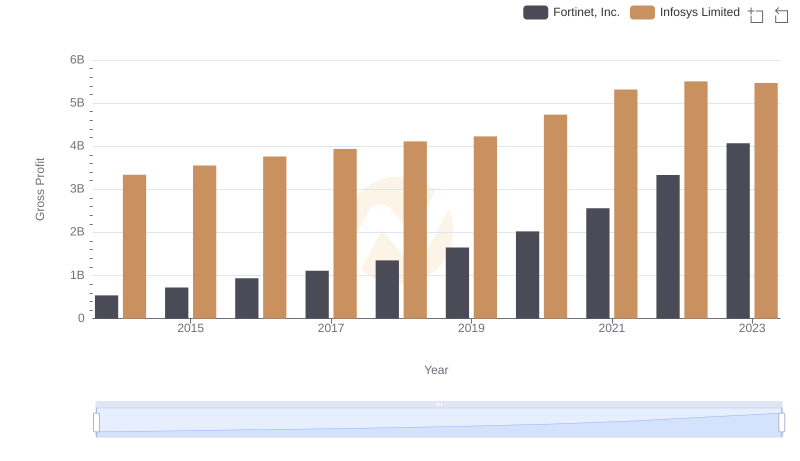
Infosys Limited vs Fortinet, Inc.: A Gross Profit Performance Breakdown
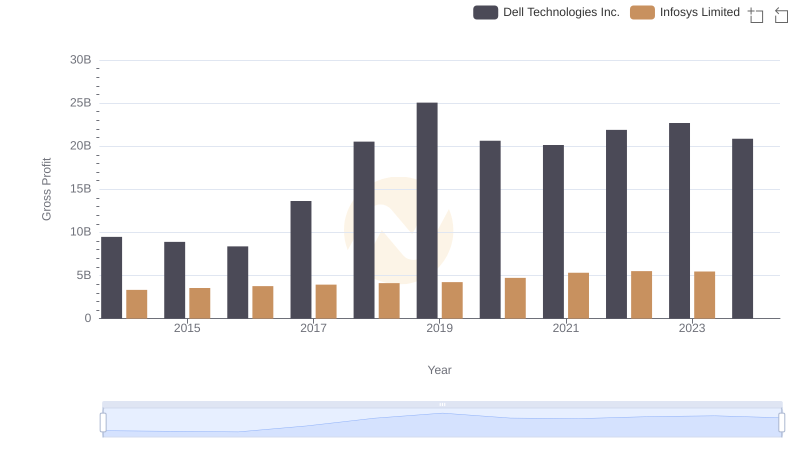
Gross Profit Trends Compared: Infosys Limited vs Dell Technologies Inc.