| __timestamp | Infosys Limited | Marvell Technology, Inc. |
|---|---|---|
| Wednesday, January 1, 2014 | 1079000000 | 259169000 |
| Thursday, January 1, 2015 | 1176000000 | 273982000 |
| Friday, January 1, 2016 | 1020000000 | 280970000 |
| Sunday, January 1, 2017 | 1279000000 | 299727000 |
| Monday, January 1, 2018 | 1220000000 | 238166000 |
| Tuesday, January 1, 2019 | 1504000000 | 424360000 |
| Wednesday, January 1, 2020 | 1223000000 | 464580000 |
| Friday, January 1, 2021 | 1391000000 | 467240000 |
| Saturday, January 1, 2022 | 1678000000 | 955245000 |
| Sunday, January 1, 2023 | 1632000000 | 843600000 |
| Monday, January 1, 2024 | 834000000 |
Unlocking the unknown
In the ever-evolving tech landscape, understanding operational efficiency is crucial. This analysis delves into the Selling, General, and Administrative (SG&A) expenses of Infosys Limited and Marvell Technology, Inc. over the past decade. From 2014 to 2023, Infosys consistently outpaced Marvell in SG&A spending, peaking at approximately $1.68 billion in 2022. This represents a 55% increase from its 2014 figures. In contrast, Marvell's SG&A expenses grew by a staggering 269%, reaching around $955 million in 2022. This sharp rise highlights Marvell's aggressive expansion strategy. However, 2023 saw a slight dip for both companies, with Infosys at $1.63 billion and Marvell at $843 million. Notably, data for 2024 is incomplete, leaving room for speculation on future trends. This comparative analysis underscores the strategic differences in managing operational costs between these two tech titans.
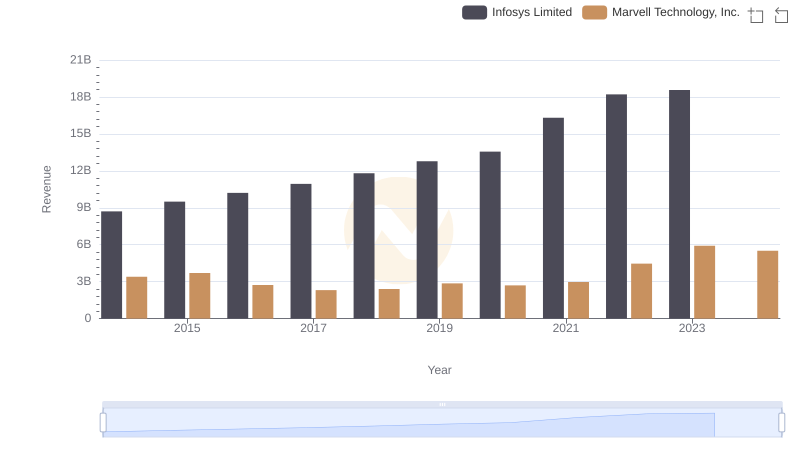
Infosys Limited and Marvell Technology, Inc.: A Comprehensive Revenue Analysis
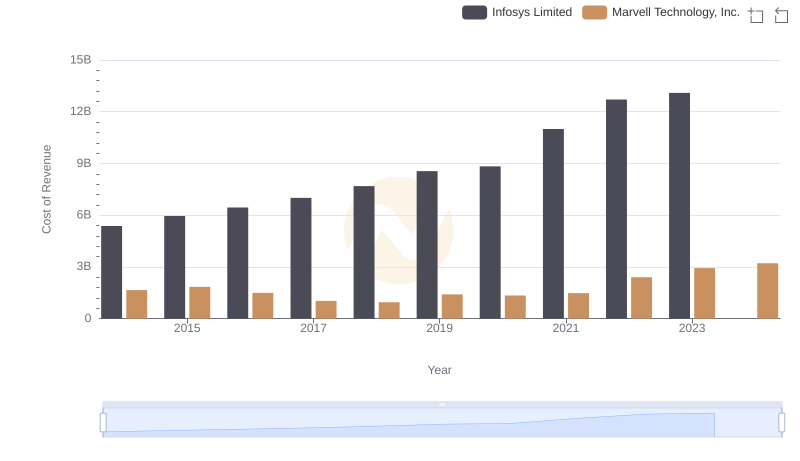
Cost of Revenue Trends: Infosys Limited vs Marvell Technology, Inc.
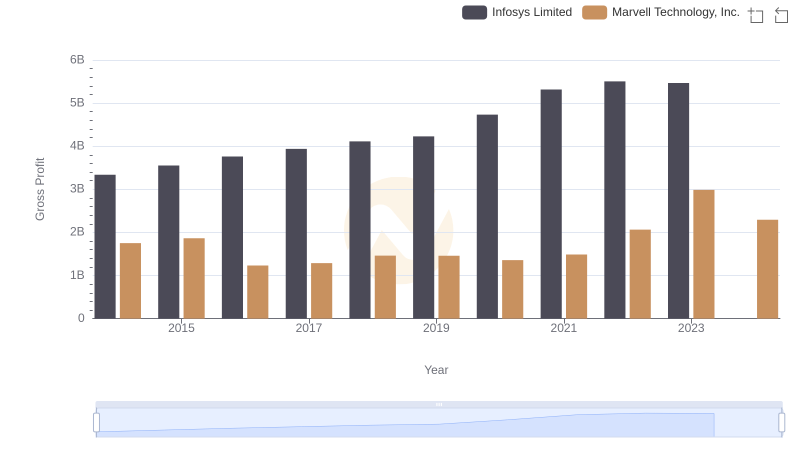
Gross Profit Trends Compared: Infosys Limited vs Marvell Technology, Inc.
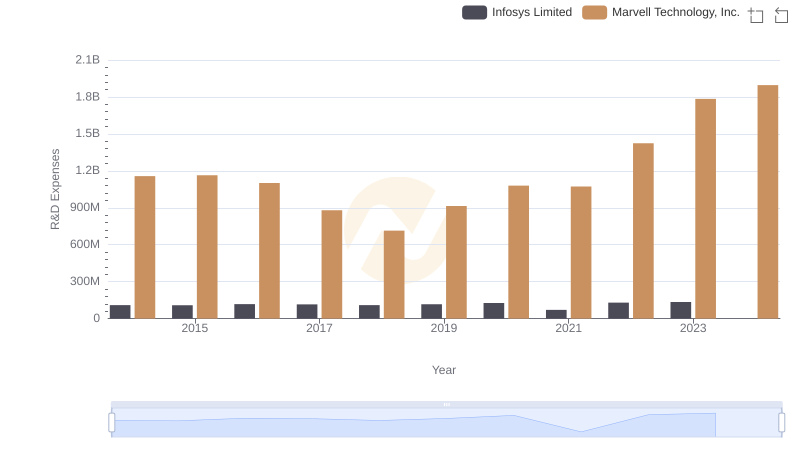
Research and Development Expenses Breakdown: Infosys Limited vs Marvell Technology, Inc.
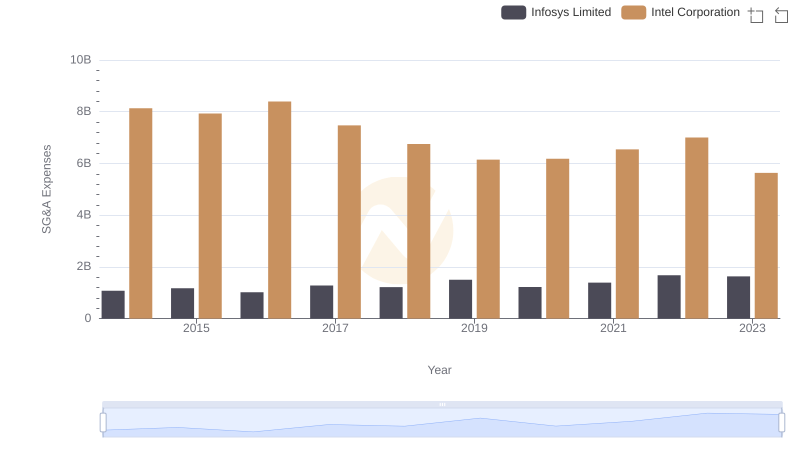
Infosys Limited and Intel Corporation: SG&A Spending Patterns Compared
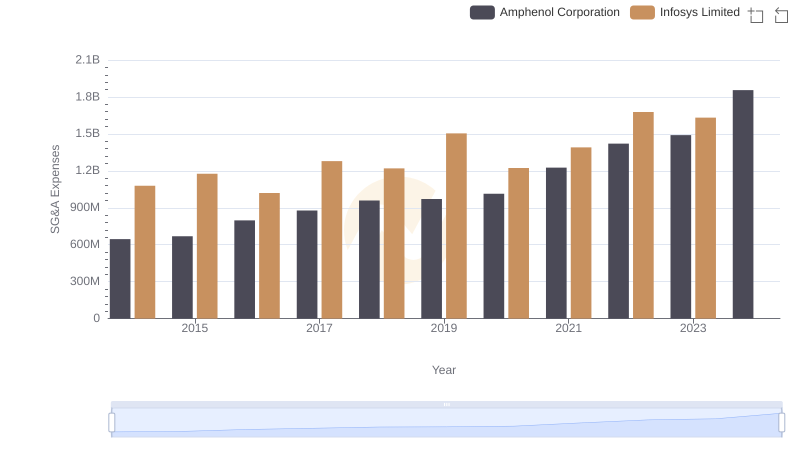
Who Optimizes SG&A Costs Better? Infosys Limited or Amphenol Corporation
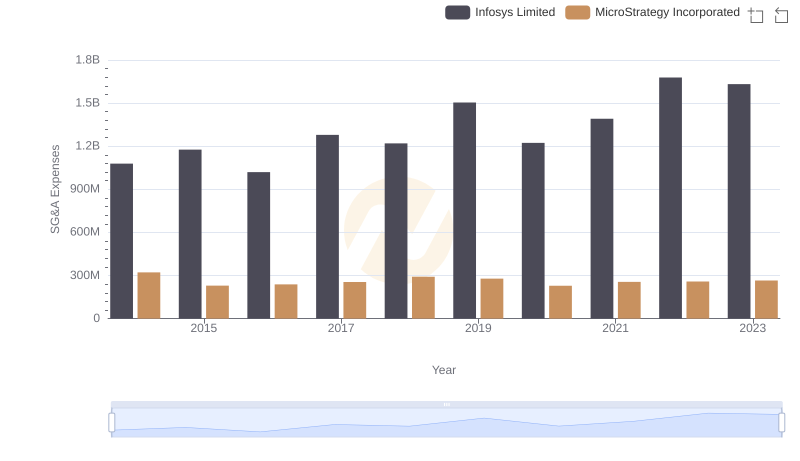
Breaking Down SG&A Expenses: Infosys Limited vs MicroStrategy Incorporated
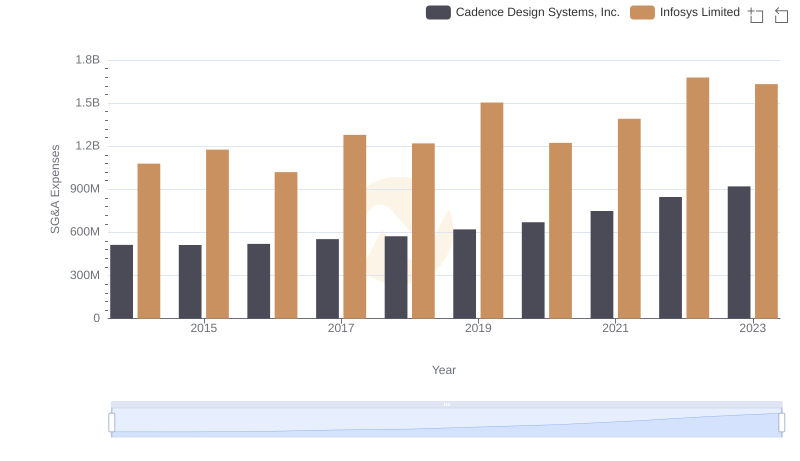
Infosys Limited or Cadence Design Systems, Inc.: Who Manages SG&A Costs Better?
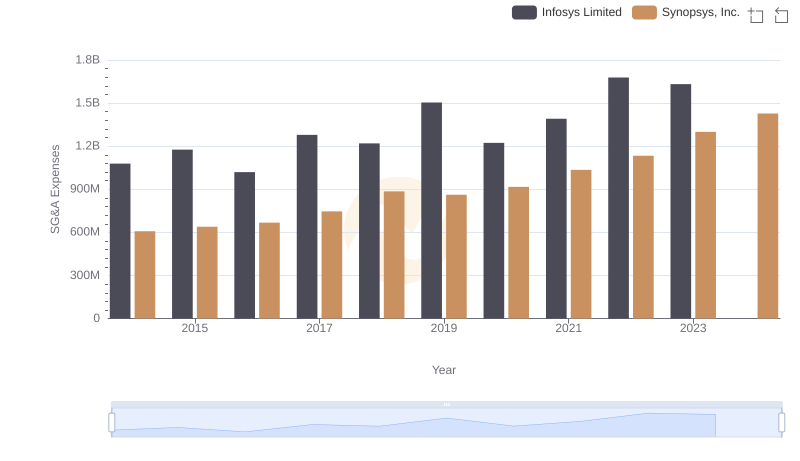
Selling, General, and Administrative Costs: Infosys Limited vs Synopsys, Inc.
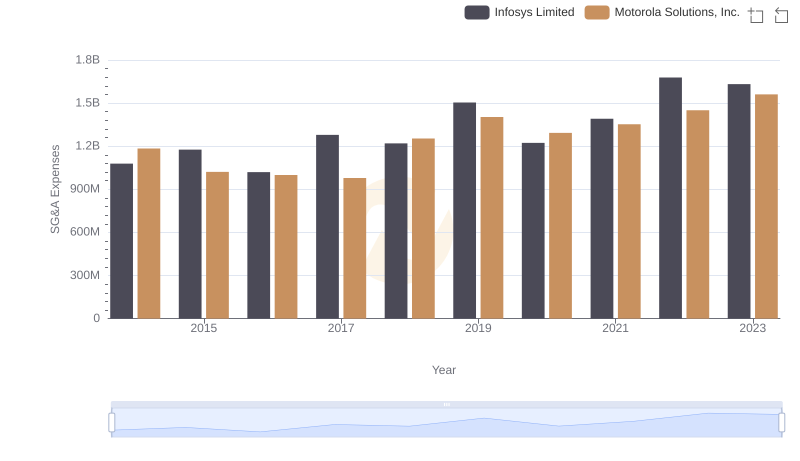
Comparing SG&A Expenses: Infosys Limited vs Motorola Solutions, Inc. Trends and Insights
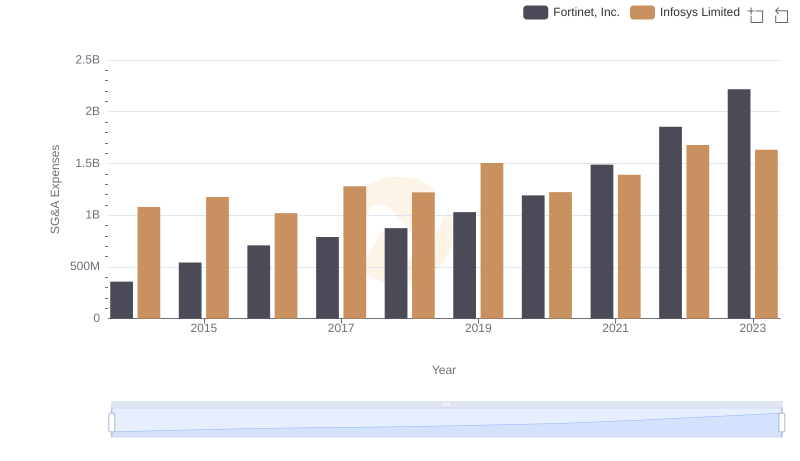
Comparing SG&A Expenses: Infosys Limited vs Fortinet, Inc. Trends and Insights
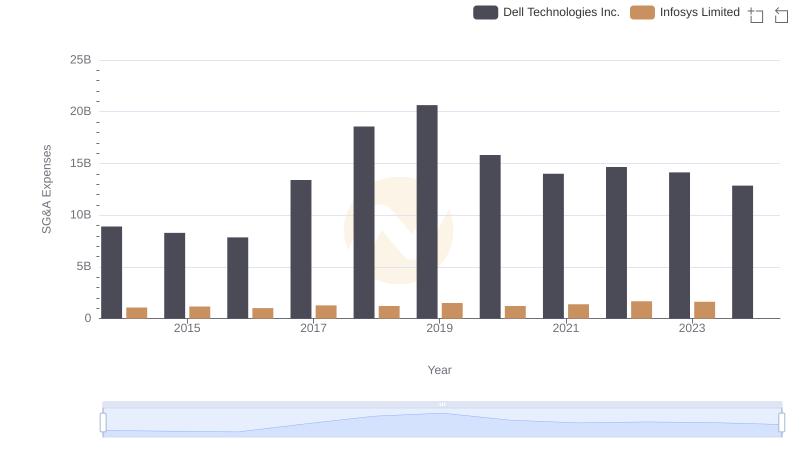
Infosys Limited or Dell Technologies Inc.: Who Manages SG&A Costs Better?