| __timestamp | Amphenol Corporation | Infosys Limited |
|---|---|---|
| Wednesday, January 1, 2014 | 1693800000 | 3337000000 |
| Thursday, January 1, 2015 | 1779500000 | 3551000000 |
| Friday, January 1, 2016 | 2040000000 | 3762000000 |
| Sunday, January 1, 2017 | 2309900000 | 3938000000 |
| Monday, January 1, 2018 | 2654900000 | 4112000000 |
| Tuesday, January 1, 2019 | 2616000000 | 4228000000 |
| Wednesday, January 1, 2020 | 2664100000 | 4733000000 |
| Friday, January 1, 2021 | 3401800000 | 5315000000 |
| Saturday, January 1, 2022 | 4028200000 | 5503000000 |
| Sunday, January 1, 2023 | 4084100000 | 5466000000 |
| Monday, January 1, 2024 | 5139700000 |
Unveiling the hidden dimensions of data
In the ever-evolving landscape of global business, the performance of industry leaders like Infosys Limited and Amphenol Corporation offers a fascinating glimpse into the dynamics of profitability. Over the past decade, Infosys has consistently outperformed Amphenol in terms of gross profit, with a notable 60% higher average profit margin. From 2014 to 2023, Infosys's gross profit surged by approximately 64%, peaking in 2022. Meanwhile, Amphenol's growth trajectory was equally impressive, with a 141% increase, reaching its zenith in 2024. This remarkable growth underscores the resilience and adaptability of these corporations in a competitive market. However, the data for Infosys in 2024 remains elusive, leaving room for speculation about its future performance. As these titans continue to innovate and expand, their financial narratives will undoubtedly shape the future of their respective industries.
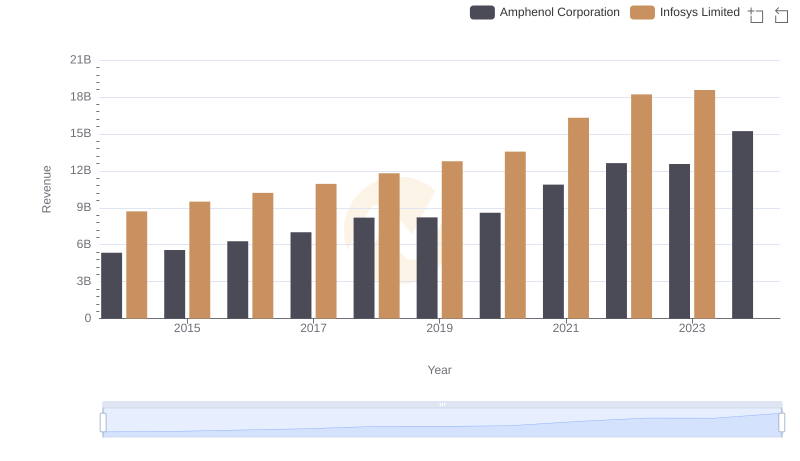
Infosys Limited vs Amphenol Corporation: Annual Revenue Growth Compared
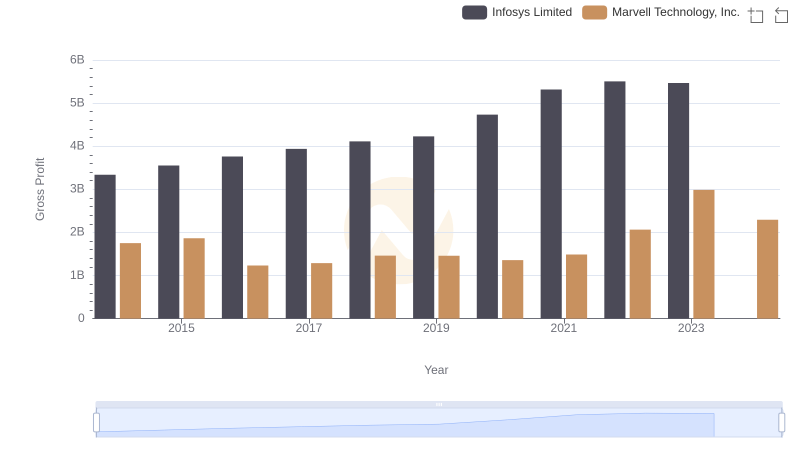
Gross Profit Trends Compared: Infosys Limited vs Marvell Technology, Inc.

Cost of Revenue: Key Insights for Infosys Limited and Amphenol Corporation
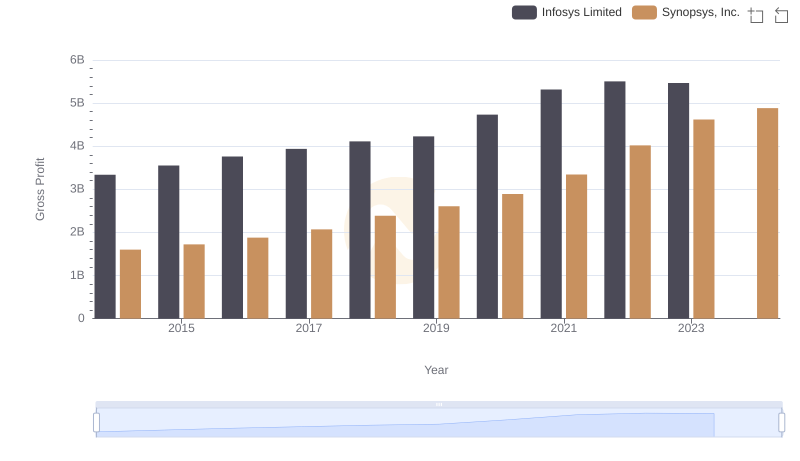
Gross Profit Analysis: Comparing Infosys Limited and Synopsys, Inc.
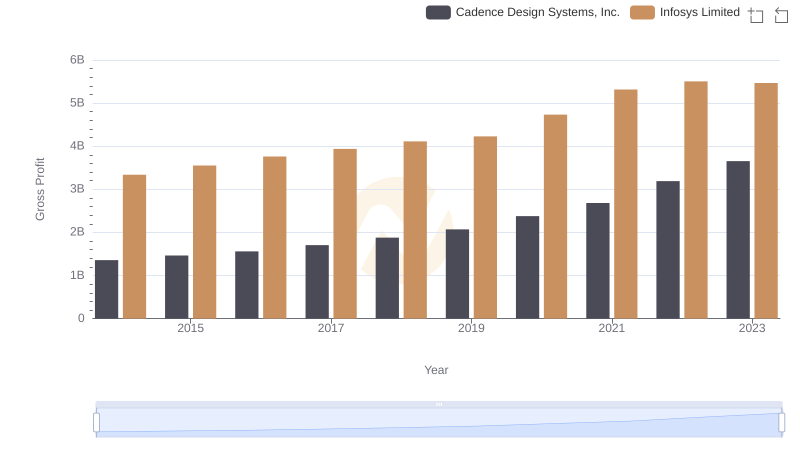
Infosys Limited and Cadence Design Systems, Inc.: A Detailed Gross Profit Analysis
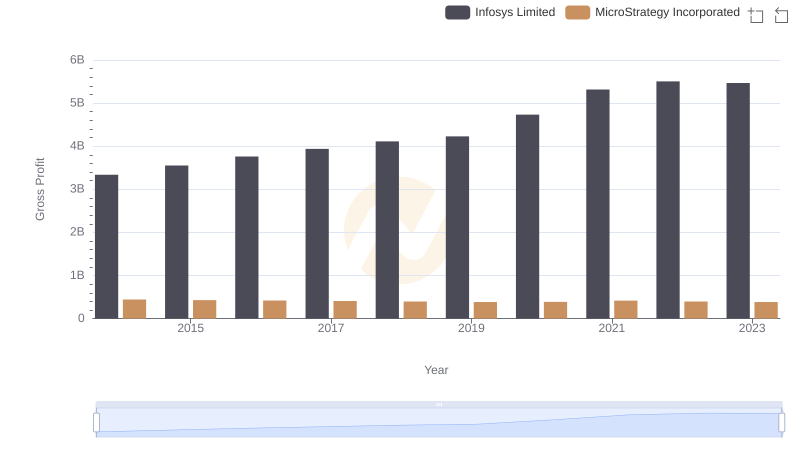
Who Generates Higher Gross Profit? Infosys Limited or MicroStrategy Incorporated
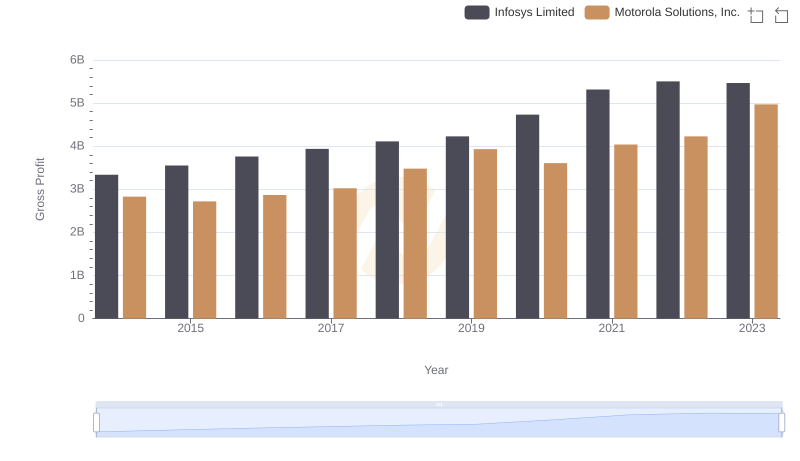
Who Generates Higher Gross Profit? Infosys Limited or Motorola Solutions, Inc.
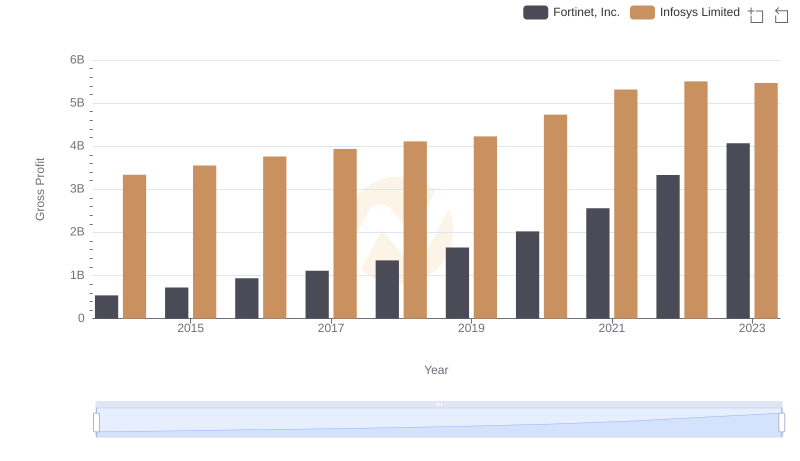
Infosys Limited vs Fortinet, Inc.: A Gross Profit Performance Breakdown
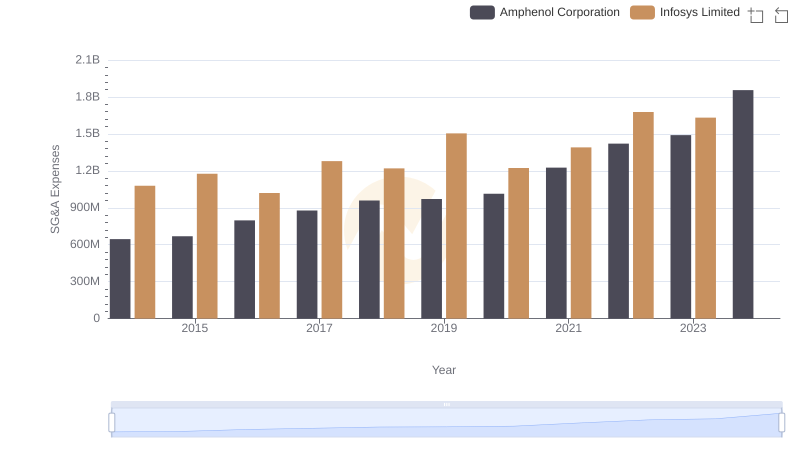
Who Optimizes SG&A Costs Better? Infosys Limited or Amphenol Corporation
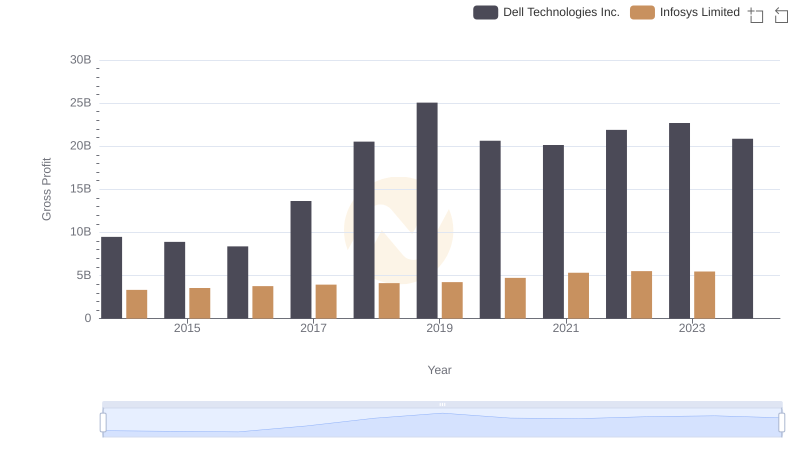
Gross Profit Trends Compared: Infosys Limited vs Dell Technologies Inc.
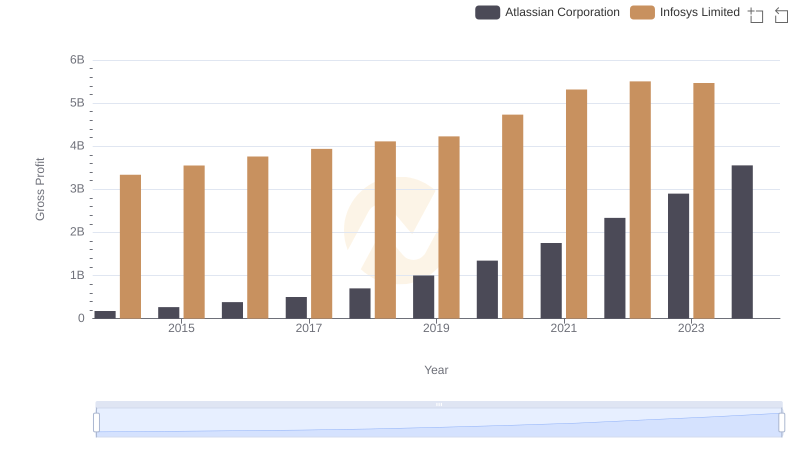
Gross Profit Comparison: Infosys Limited and Atlassian Corporation Trends
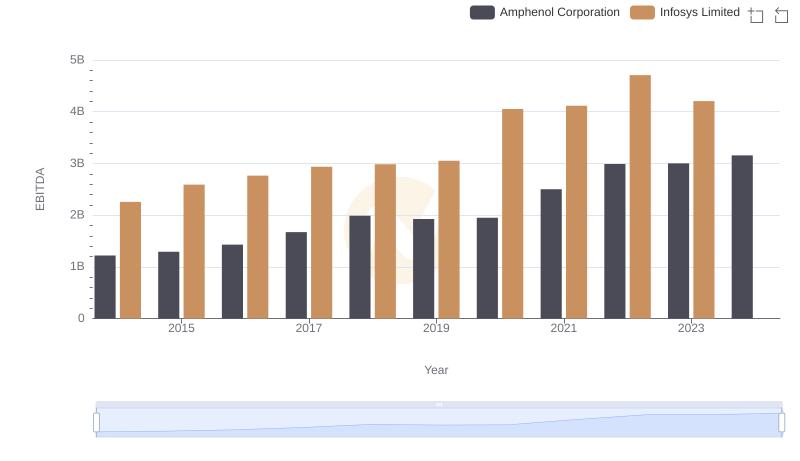
A Side-by-Side Analysis of EBITDA: Infosys Limited and Amphenol Corporation