| __timestamp | Infosys Limited | Synopsys, Inc. |
|---|---|---|
| Wednesday, January 1, 2014 | 3337000000 | 1600587000 |
| Thursday, January 1, 2015 | 3551000000 | 1723291000 |
| Friday, January 1, 2016 | 3762000000 | 1879570000 |
| Sunday, January 1, 2017 | 3938000000 | 2070696000 |
| Monday, January 1, 2018 | 4112000000 | 2385160000 |
| Tuesday, January 1, 2019 | 4228000000 | 2607748000 |
| Wednesday, January 1, 2020 | 4733000000 | 2890591000 |
| Friday, January 1, 2021 | 5315000000 | 3342416000 |
| Saturday, January 1, 2022 | 5503000000 | 4017845000 |
| Sunday, January 1, 2023 | 5466000000 | 4620426000 |
| Monday, January 1, 2024 | 4882147000 |
Igniting the spark of knowledge
In the ever-evolving landscape of technology, the financial performance of industry giants like Infosys Limited and Synopsys, Inc. offers a fascinating glimpse into their strategic prowess. Over the past decade, Infosys has demonstrated a robust growth trajectory, with its gross profit surging by approximately 64% from 2014 to 2023. This growth underscores Infosys's ability to adapt and thrive in a competitive market.
Meanwhile, Synopsys, Inc. has also shown impressive progress, with its gross profit nearly tripling over the same period. This remarkable 189% increase highlights Synopsys's strategic focus on innovation and expansion in the semiconductor industry.
While Infosys's data for 2024 is not yet available, Synopsys continues its upward trend, projecting further growth. This comparison not only showcases the financial health of these tech titans but also reflects broader industry trends and the dynamic nature of global technology markets.
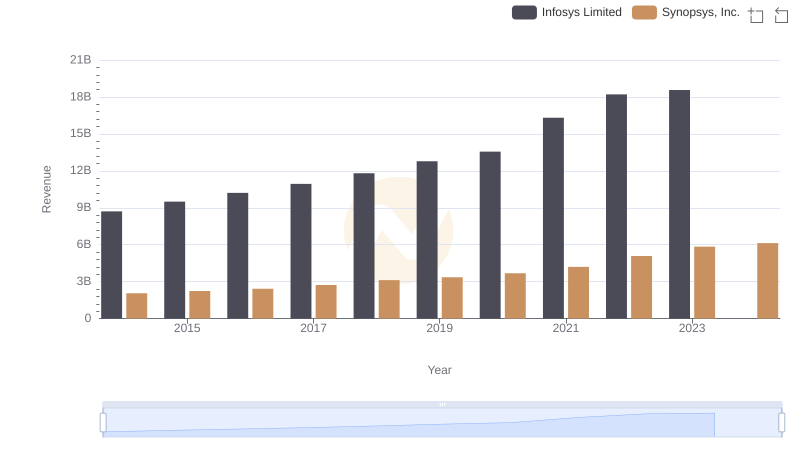
Revenue Insights: Infosys Limited and Synopsys, Inc. Performance Compared
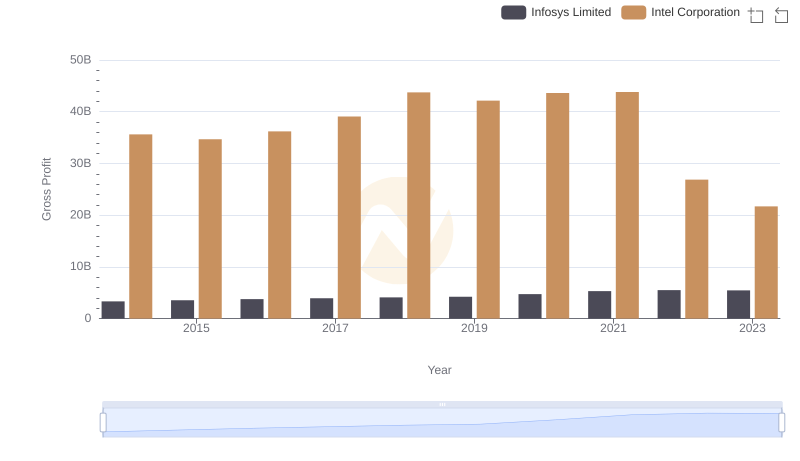
Gross Profit Analysis: Comparing Infosys Limited and Intel Corporation
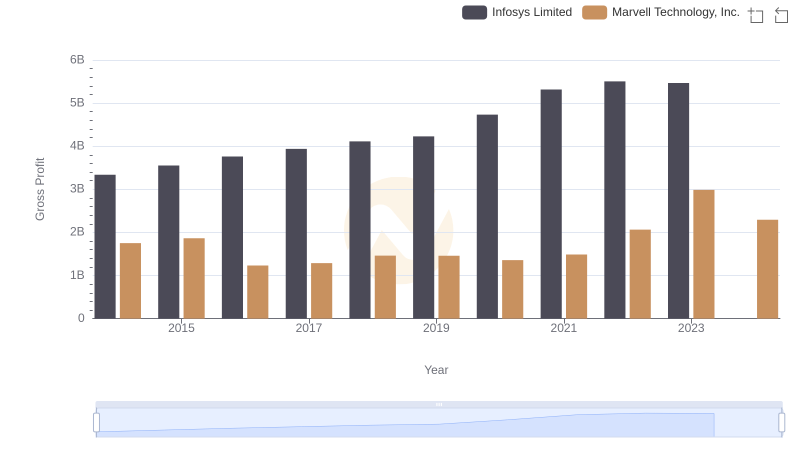
Gross Profit Trends Compared: Infosys Limited vs Marvell Technology, Inc.
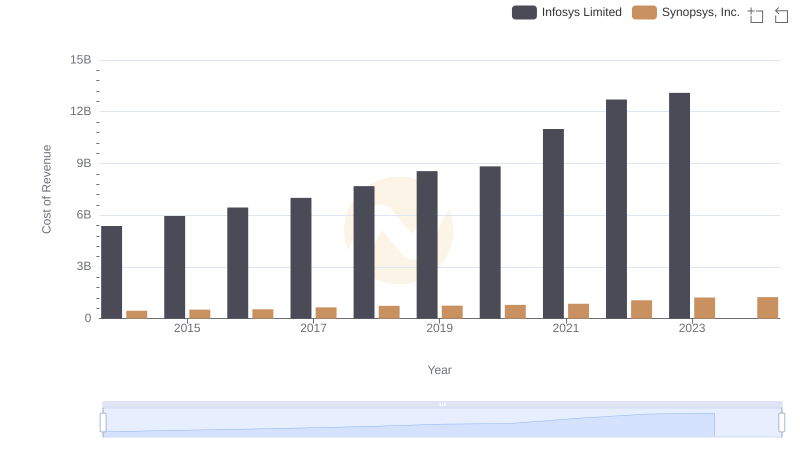
Cost of Revenue: Key Insights for Infosys Limited and Synopsys, Inc.
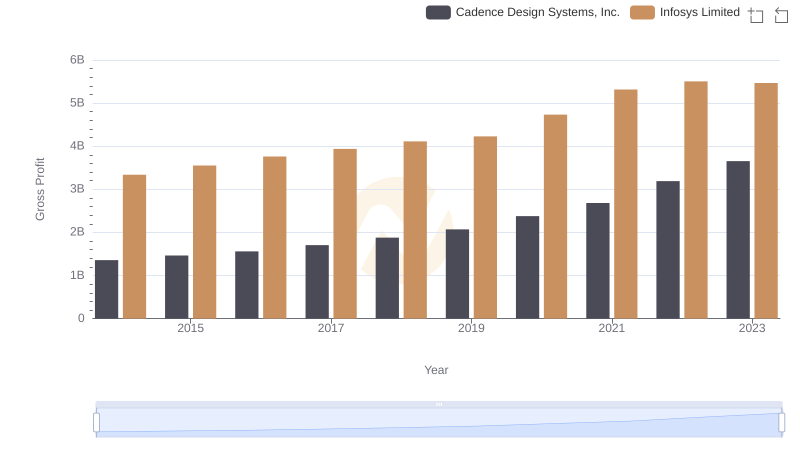
Infosys Limited and Cadence Design Systems, Inc.: A Detailed Gross Profit Analysis
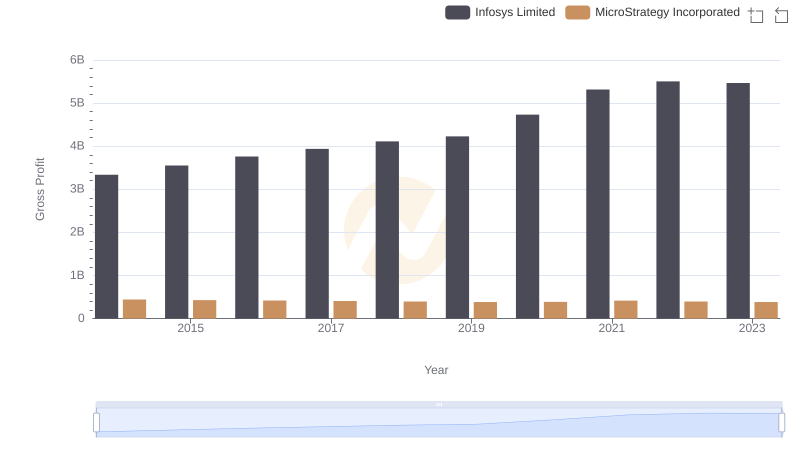
Who Generates Higher Gross Profit? Infosys Limited or MicroStrategy Incorporated
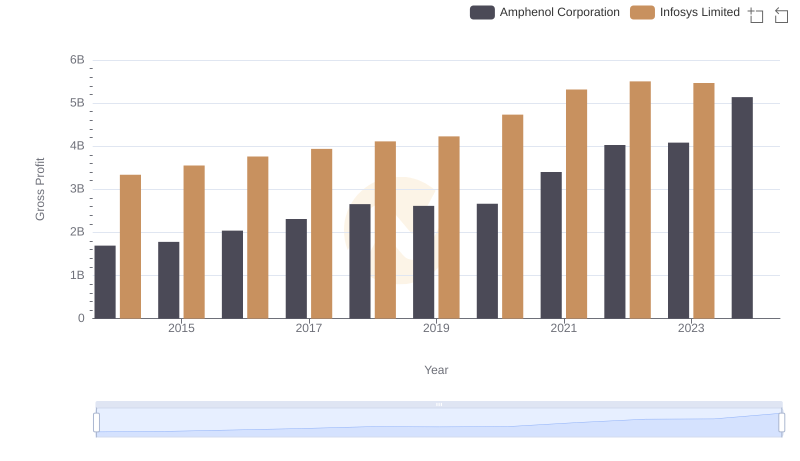
Infosys Limited vs Amphenol Corporation: A Gross Profit Performance Breakdown
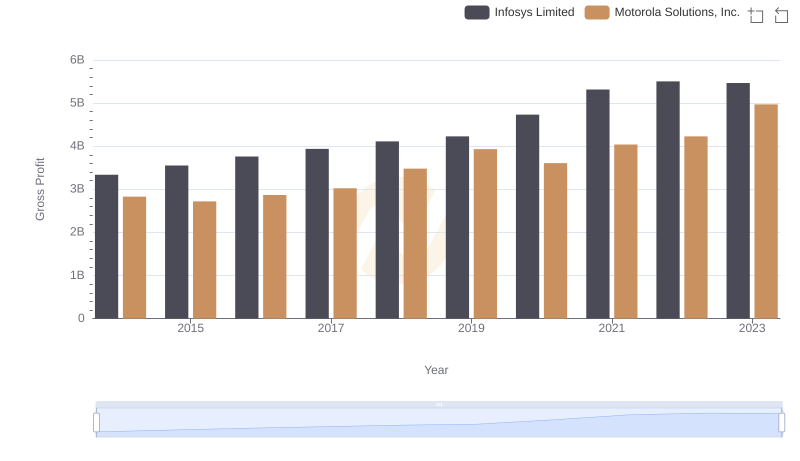
Who Generates Higher Gross Profit? Infosys Limited or Motorola Solutions, Inc.
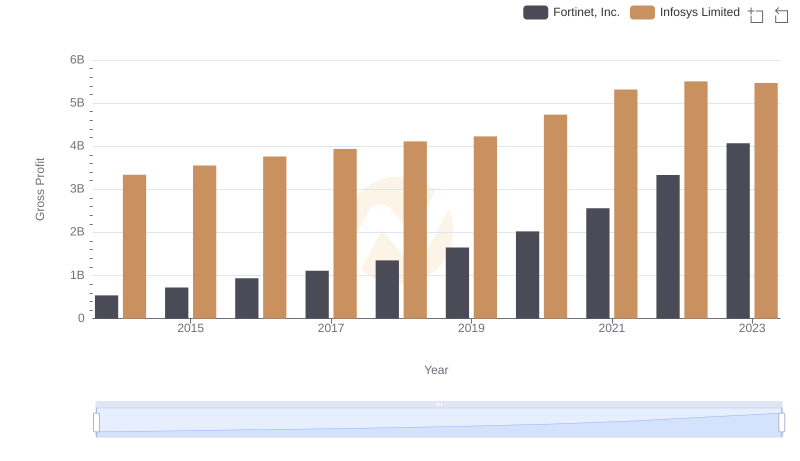
Infosys Limited vs Fortinet, Inc.: A Gross Profit Performance Breakdown
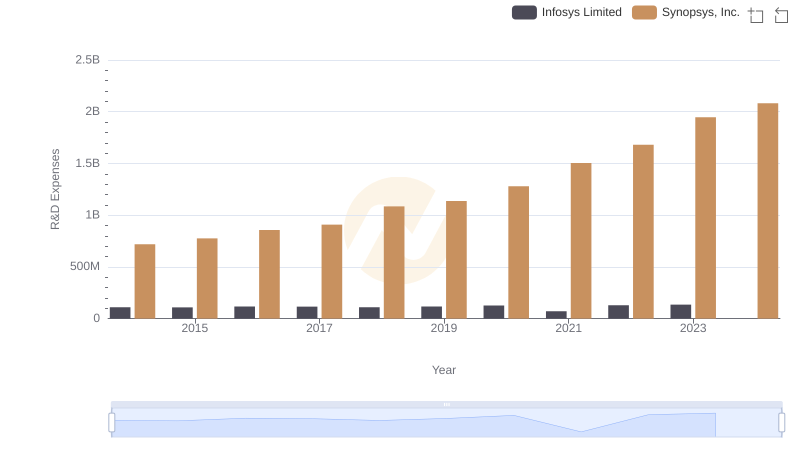
Research and Development Investment: Infosys Limited vs Synopsys, Inc.
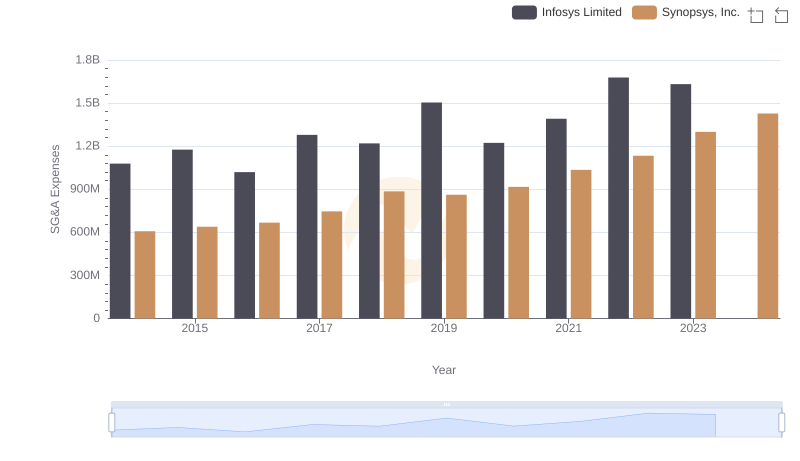
Selling, General, and Administrative Costs: Infosys Limited vs Synopsys, Inc.
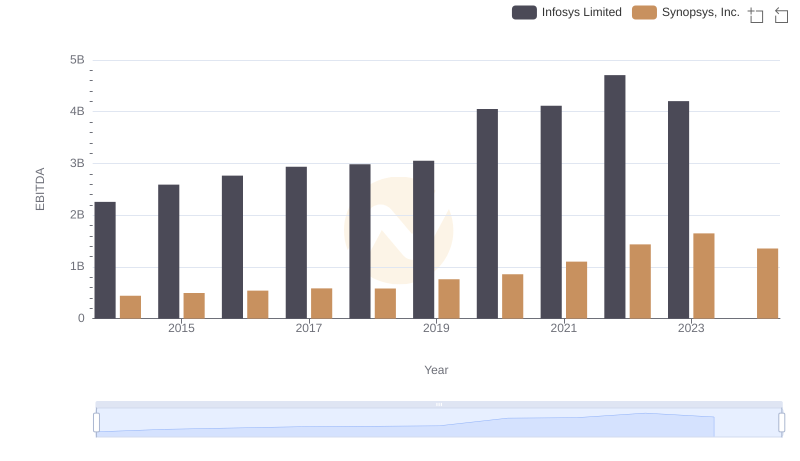
EBITDA Performance Review: Infosys Limited vs Synopsys, Inc.