| __timestamp | Infosys Limited | Marvell Technology, Inc. |
|---|---|---|
| Wednesday, January 1, 2014 | 5374000000 | 1654230000 |
| Thursday, January 1, 2015 | 5950000000 | 1843706000 |
| Friday, January 1, 2016 | 6446000000 | 1494736000 |
| Sunday, January 1, 2017 | 7001000000 | 1029527000 |
| Monday, January 1, 2018 | 7687000000 | 947230000 |
| Tuesday, January 1, 2019 | 8552000000 | 1407399000 |
| Wednesday, January 1, 2020 | 8828000000 | 1342220000 |
| Friday, January 1, 2021 | 10996000000 | 1480550000 |
| Saturday, January 1, 2022 | 12709000000 | 2398158000 |
| Sunday, January 1, 2023 | 13096000000 | 2932100000 |
| Monday, January 1, 2024 | 3214100000 |
Igniting the spark of knowledge
In the ever-evolving tech landscape, understanding cost dynamics is crucial. Infosys Limited and Marvell Technology, Inc. offer a fascinating study in contrasts. From 2014 to 2023, Infosys's cost of revenue surged by approximately 144%, reflecting its expanding global footprint and service offerings. In contrast, Marvell Technology, Inc. experienced a more modest increase of around 77% over the same period, indicative of its strategic focus on niche semiconductor markets.
These trends underscore the diverse strategies of these tech titans in navigating the competitive landscape.
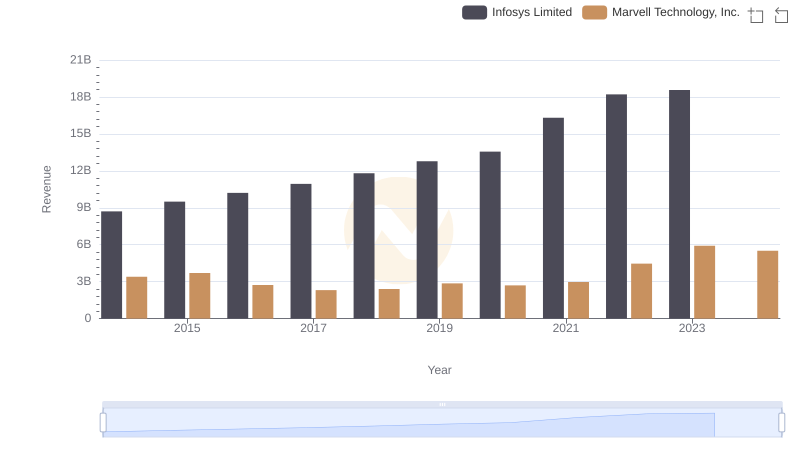
Infosys Limited and Marvell Technology, Inc.: A Comprehensive Revenue Analysis
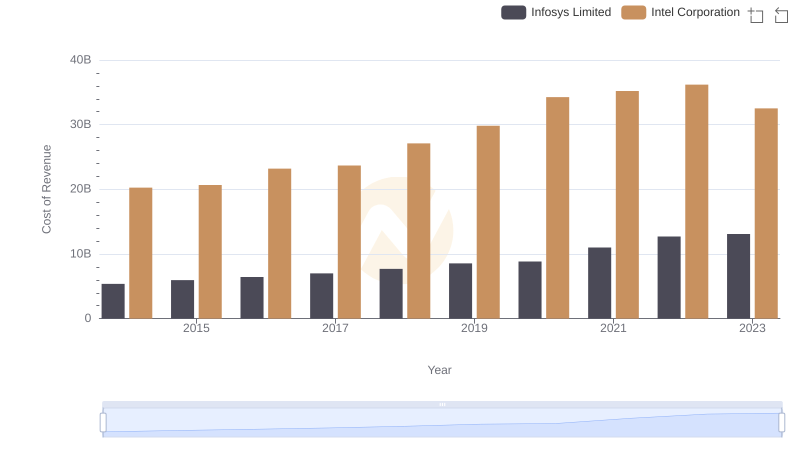
Infosys Limited vs Intel Corporation: Efficiency in Cost of Revenue Explored
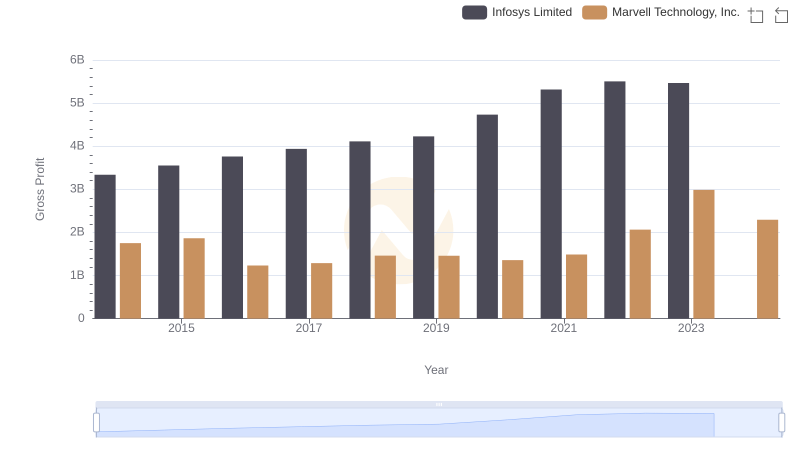
Gross Profit Trends Compared: Infosys Limited vs Marvell Technology, Inc.
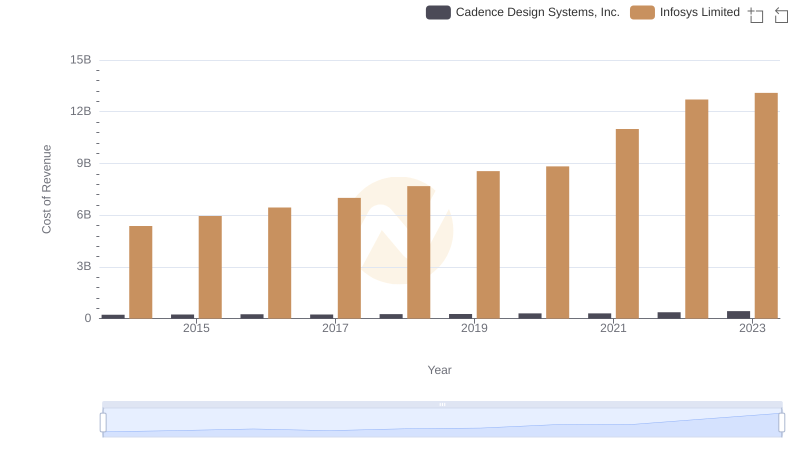
Cost Insights: Breaking Down Infosys Limited and Cadence Design Systems, Inc.'s Expenses
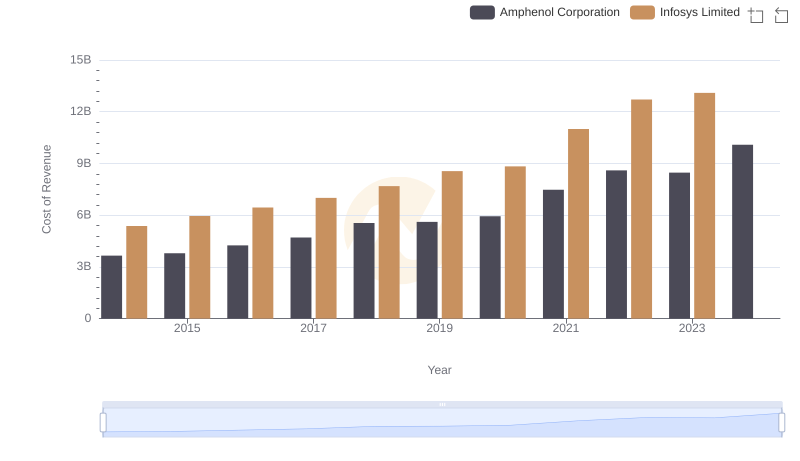
Cost of Revenue: Key Insights for Infosys Limited and Amphenol Corporation
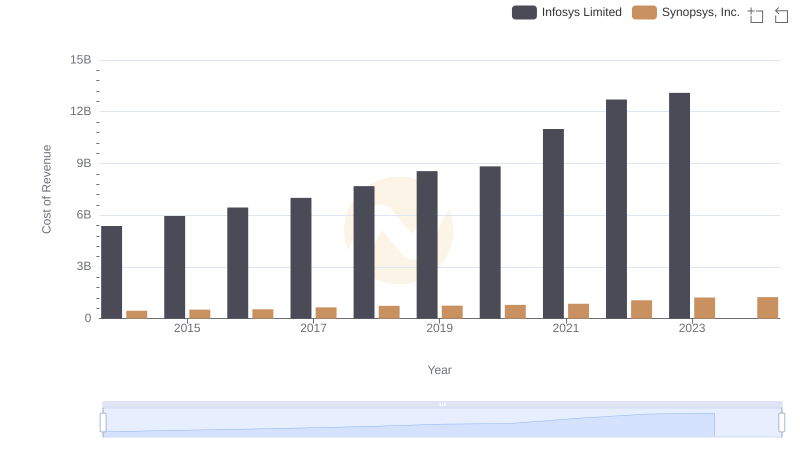
Cost of Revenue: Key Insights for Infosys Limited and Synopsys, Inc.
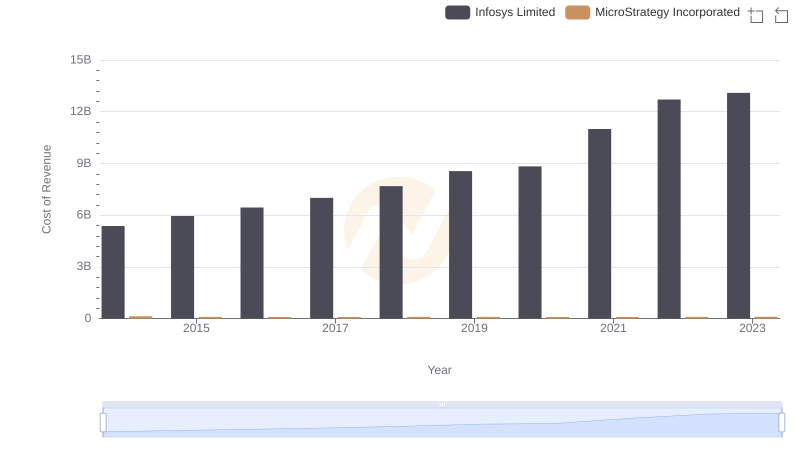
Cost of Revenue Comparison: Infosys Limited vs MicroStrategy Incorporated
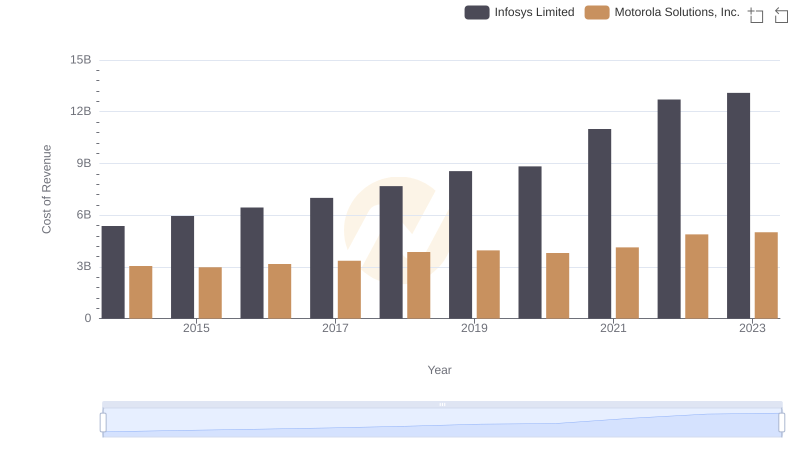
Cost of Revenue Comparison: Infosys Limited vs Motorola Solutions, Inc.
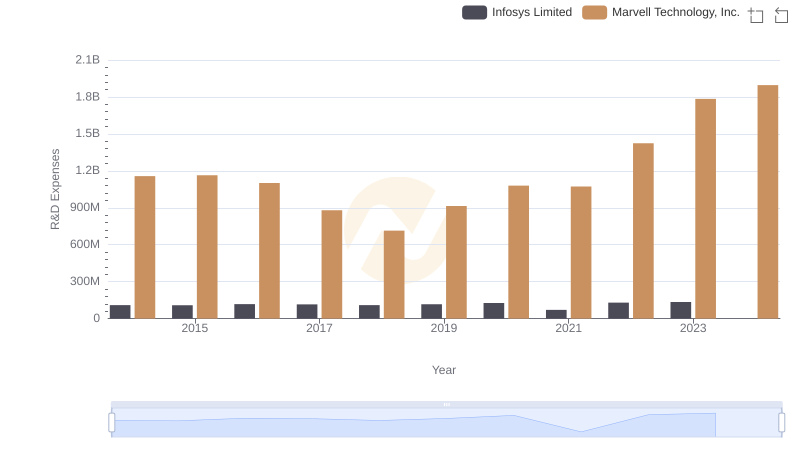
Research and Development Expenses Breakdown: Infosys Limited vs Marvell Technology, Inc.
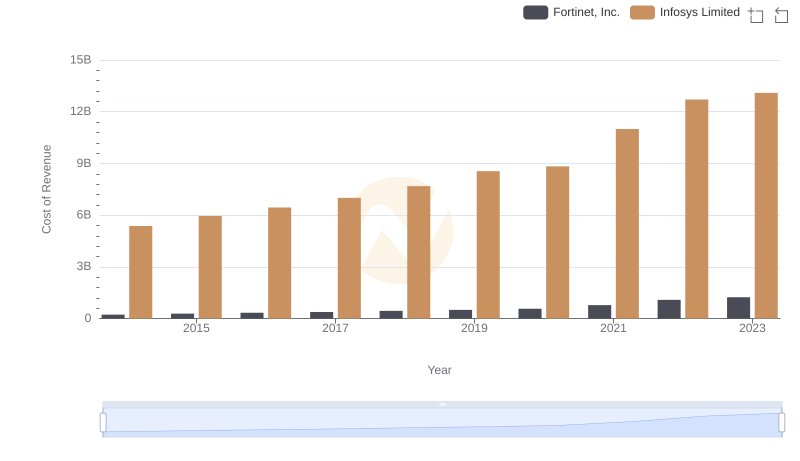
Cost of Revenue Comparison: Infosys Limited vs Fortinet, Inc.
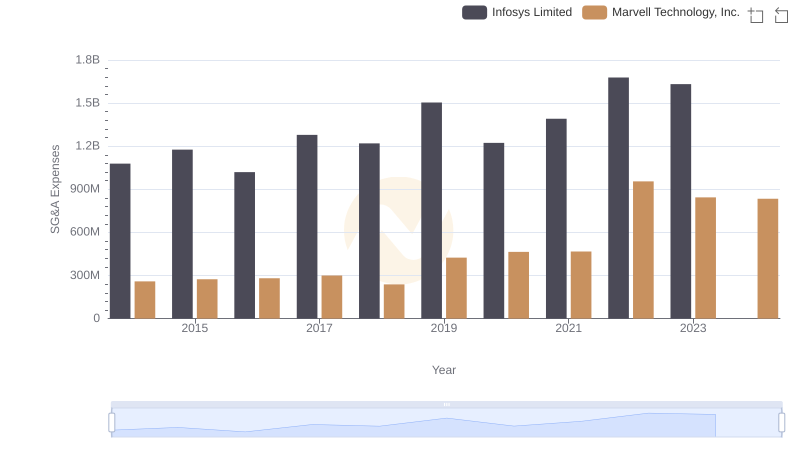
SG&A Efficiency Analysis: Comparing Infosys Limited and Marvell Technology, Inc.
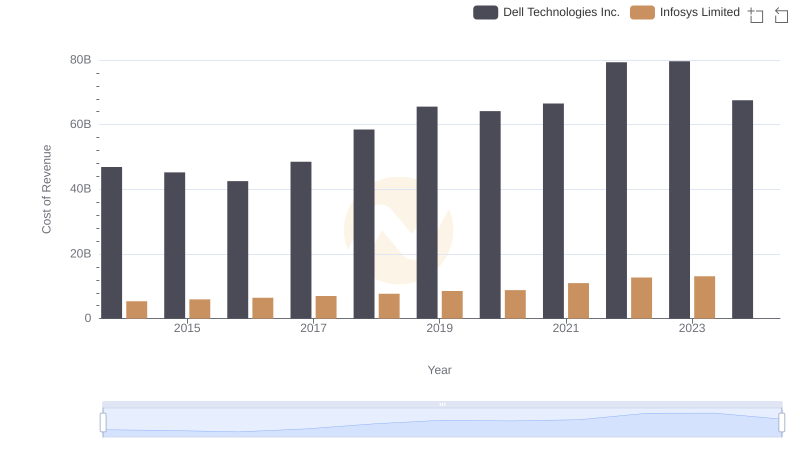
Cost Insights: Breaking Down Infosys Limited and Dell Technologies Inc.'s Expenses