| __timestamp | Infosys Limited | Marvell Technology, Inc. |
|---|---|---|
| Wednesday, January 1, 2014 | 110000000 | 1156885000 |
| Thursday, January 1, 2015 | 108750722 | 1164059000 |
| Friday, January 1, 2016 | 117660969 | 1101446000 |
| Sunday, January 1, 2017 | 116030068 | 880050000 |
| Monday, January 1, 2018 | 109947154 | 714444000 |
| Tuesday, January 1, 2019 | 116915374 | 914009000 |
| Wednesday, January 1, 2020 | 127298402 | 1080391000 |
| Friday, January 1, 2021 | 70997544 | 1072740000 |
| Saturday, January 1, 2022 | 129656701 | 1424306000 |
| Sunday, January 1, 2023 | 135037609 | 1784300000 |
| Monday, January 1, 2024 | 1896200000 |
Unleashing insights
In the ever-evolving tech landscape, research and development (R&D) investments are pivotal for innovation and growth. This analysis delves into the R&D spending trends of two tech giants: Infosys Limited and Marvell Technology, Inc., from 2014 to 2023.
Infosys Limited, a leader in IT services, consistently allocated around 8% of its annual budget to R&D, peaking in 2023 with a 20% increase from 2014. In contrast, Marvell Technology, Inc., a semiconductor powerhouse, demonstrated a more aggressive R&D strategy, with expenditures soaring by over 50% during the same period. Notably, Marvell's R&D spending in 2023 was nearly 13 times that of Infosys, underscoring its commitment to cutting-edge semiconductor solutions.
While Infosys maintained steady growth, Marvell's dynamic investment approach highlights its focus on innovation, positioning it as a formidable player in the semiconductor industry.
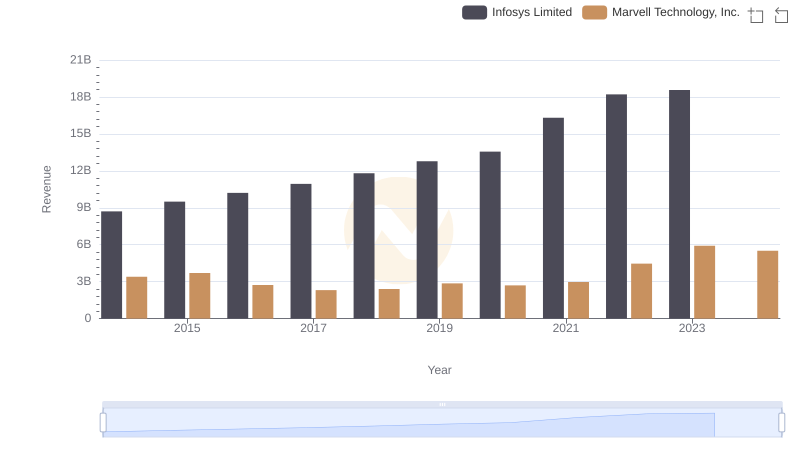
Infosys Limited and Marvell Technology, Inc.: A Comprehensive Revenue Analysis
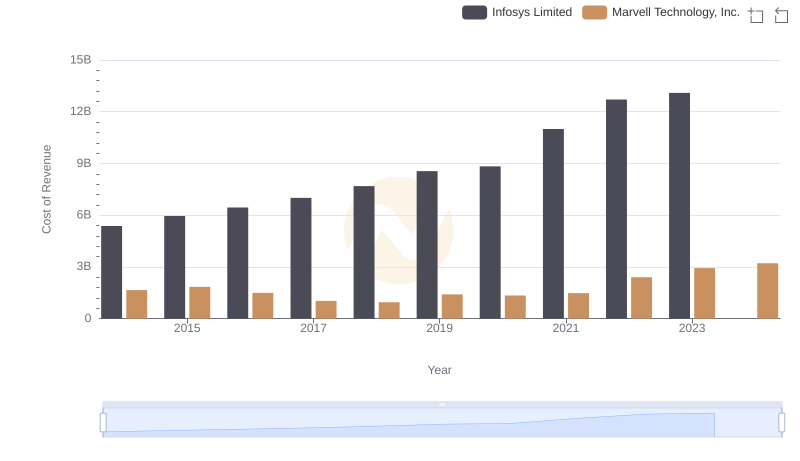
Cost of Revenue Trends: Infosys Limited vs Marvell Technology, Inc.
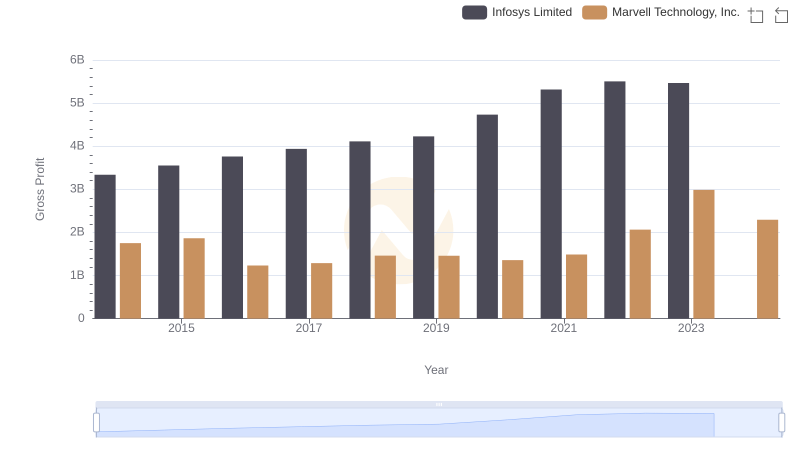
Gross Profit Trends Compared: Infosys Limited vs Marvell Technology, Inc.
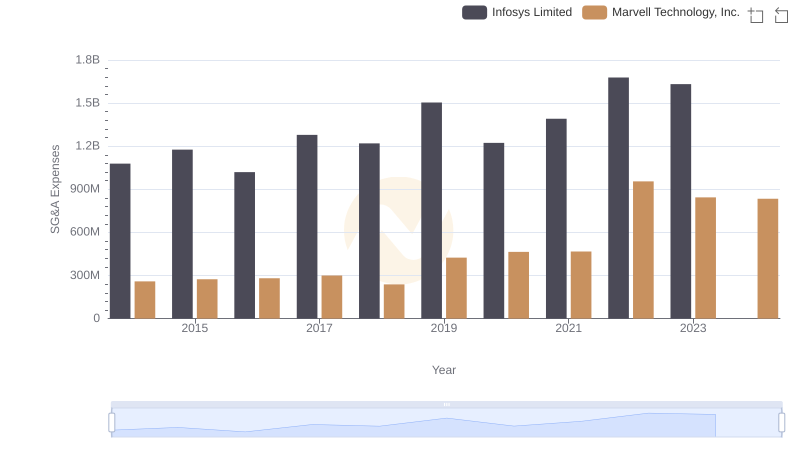
SG&A Efficiency Analysis: Comparing Infosys Limited and Marvell Technology, Inc.
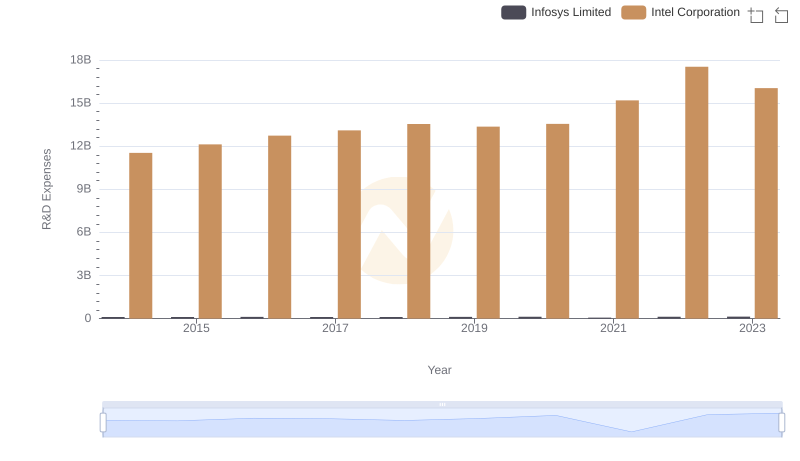
Research and Development: Comparing Key Metrics for Infosys Limited and Intel Corporation
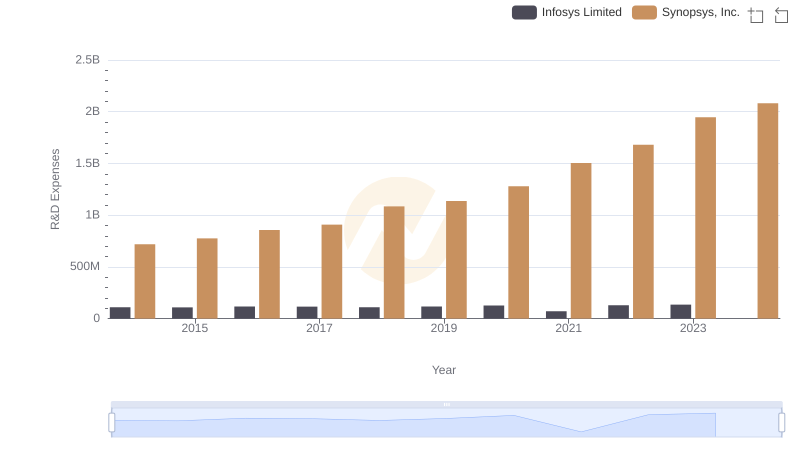
Research and Development Investment: Infosys Limited vs Synopsys, Inc.
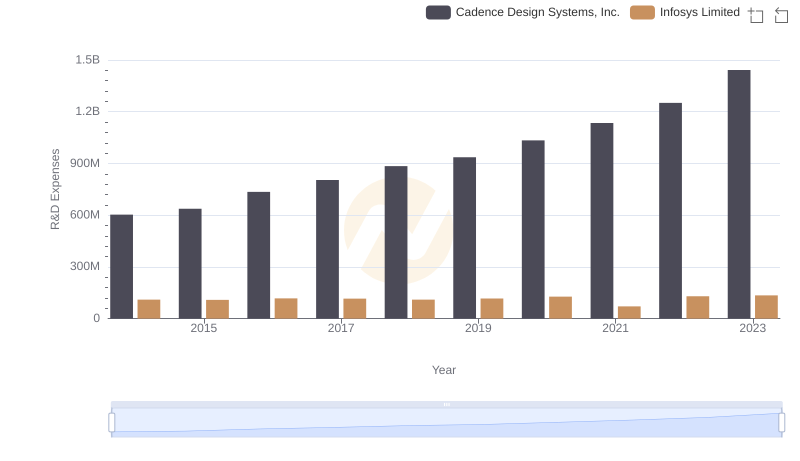
Infosys Limited or Cadence Design Systems, Inc.: Who Invests More in Innovation?
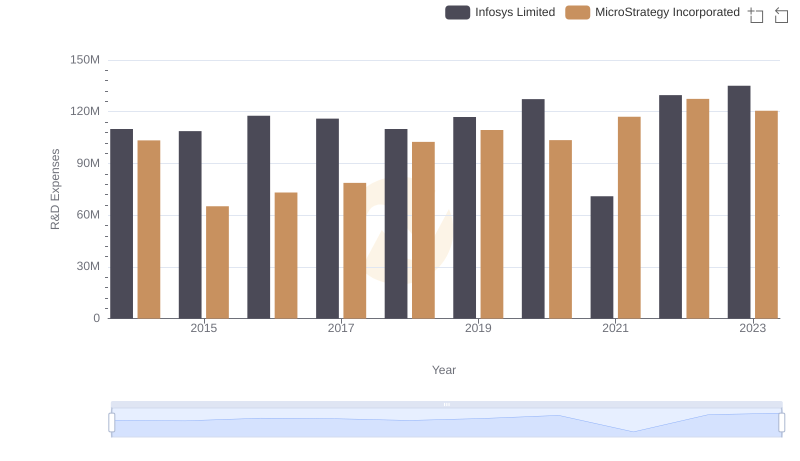
Analyzing R&D Budgets: Infosys Limited vs MicroStrategy Incorporated
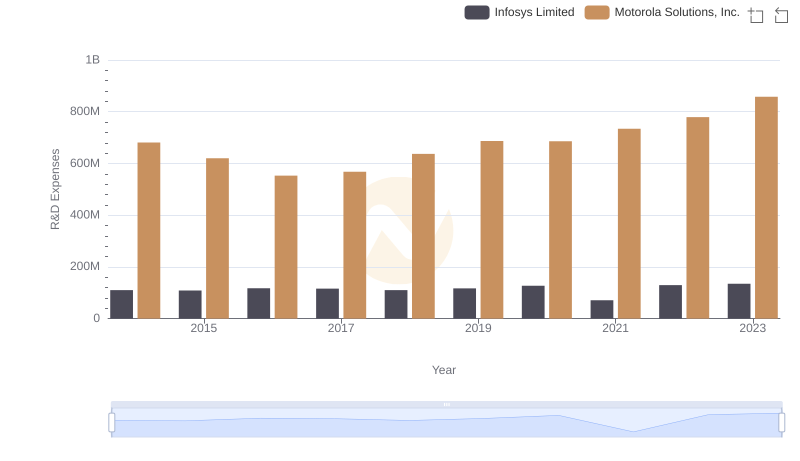
Comparing Innovation Spending: Infosys Limited and Motorola Solutions, Inc.
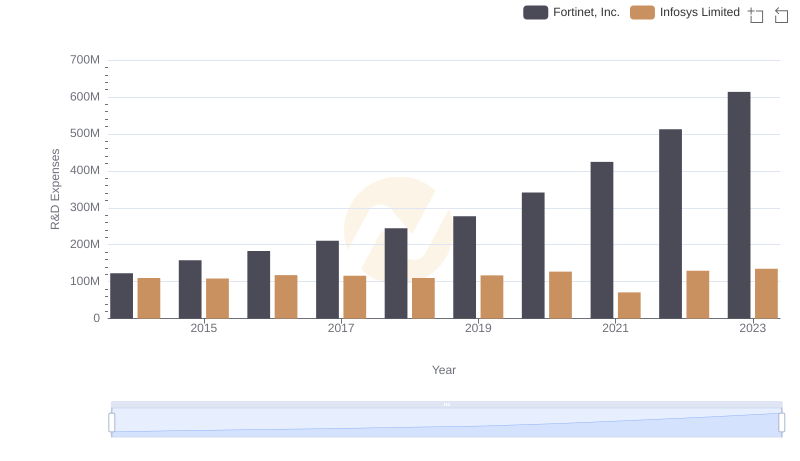
Research and Development: Comparing Key Metrics for Infosys Limited and Fortinet, Inc.
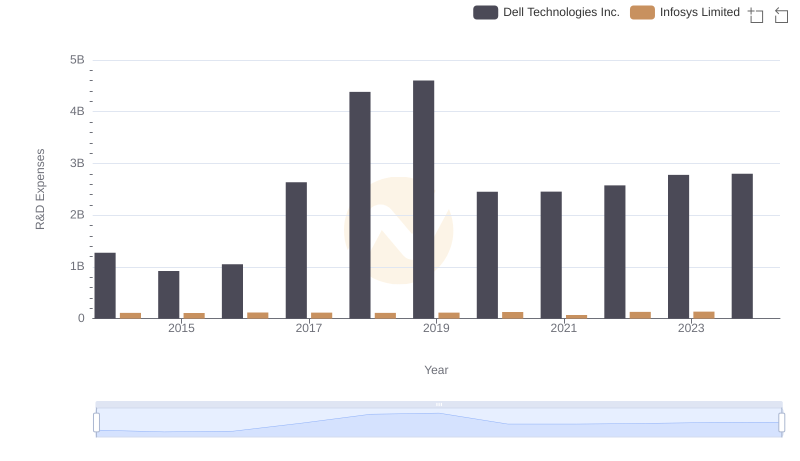
Research and Development Investment: Infosys Limited vs Dell Technologies Inc.
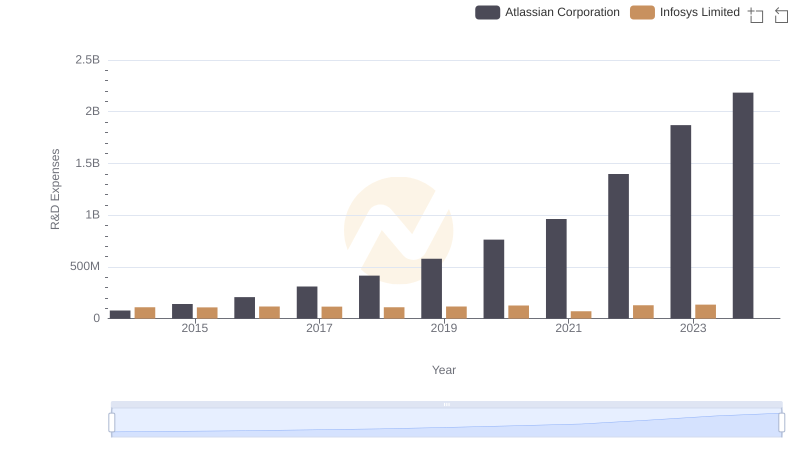
R&D Spending Showdown: Infosys Limited vs Atlassian Corporation