| __timestamp | Dell Technologies Inc. | Infosys Limited |
|---|---|---|
| Wednesday, January 1, 2014 | 1108000000 | 2258000000 |
| Thursday, January 1, 2015 | 2569000000 | 2590000000 |
| Friday, January 1, 2016 | 2266000000 | 2765000000 |
| Sunday, January 1, 2017 | 2591000000 | 2936000000 |
| Monday, January 1, 2018 | 6271000000 | 2984000000 |
| Tuesday, January 1, 2019 | 7873000000 | 3053000000 |
| Wednesday, January 1, 2020 | 8814000000 | 4053342784 |
| Friday, January 1, 2021 | 9925000000 | 4116000000 |
| Saturday, January 1, 2022 | 12016000000 | 4707334610 |
| Sunday, January 1, 2023 | 7603000000 | 4206000000 |
| Monday, January 1, 2024 | 8746000000 |
Unleashing the power of data
In the ever-evolving landscape of global technology giants, the EBITDA performance of Infosys Limited and Dell Technologies Inc. offers a fascinating glimpse into their financial health over the past decade. From 2014 to 2023, Dell Technologies has consistently outperformed Infosys in terms of EBITDA, with a peak in 2022 where Dell's EBITDA was approximately 155% higher than Infosys. Notably, Dell's EBITDA surged by over 980% from 2014 to 2022, reflecting its robust growth strategy and market adaptability. In contrast, Infosys demonstrated steady growth, with its EBITDA increasing by around 108% during the same period. However, the data for 2024 shows a missing value for Infosys, indicating a potential gap in reporting or a strategic shift. This analysis underscores the dynamic nature of the tech industry and the varying strategies employed by these two leaders to maintain their competitive edge.
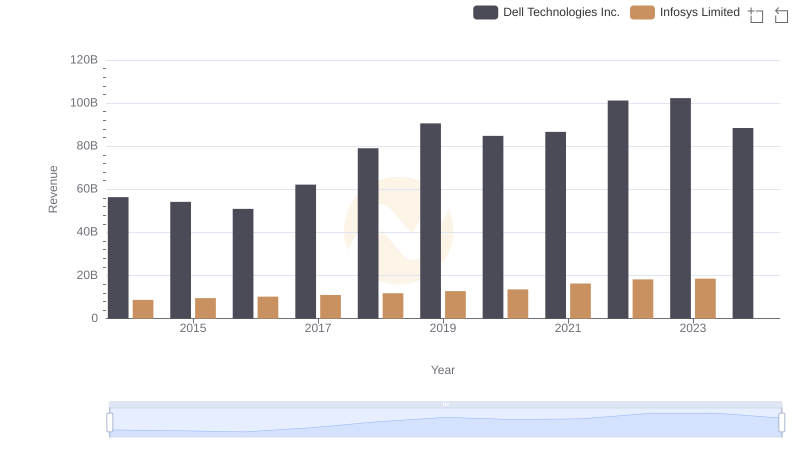
Annual Revenue Comparison: Infosys Limited vs Dell Technologies Inc.
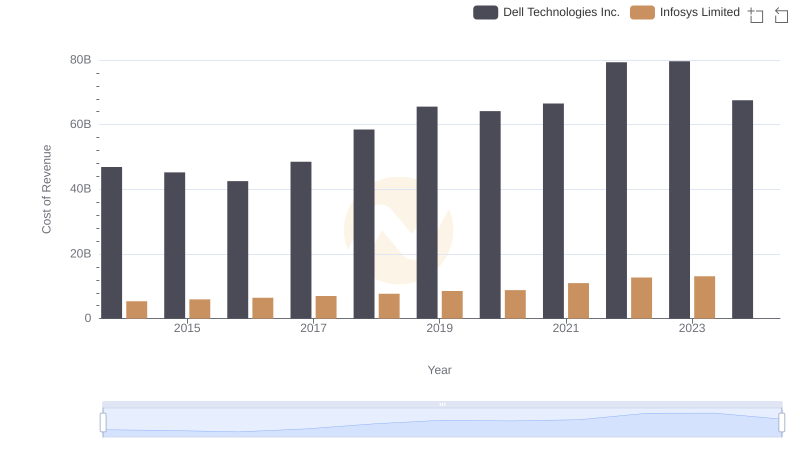
Cost Insights: Breaking Down Infosys Limited and Dell Technologies Inc.'s Expenses
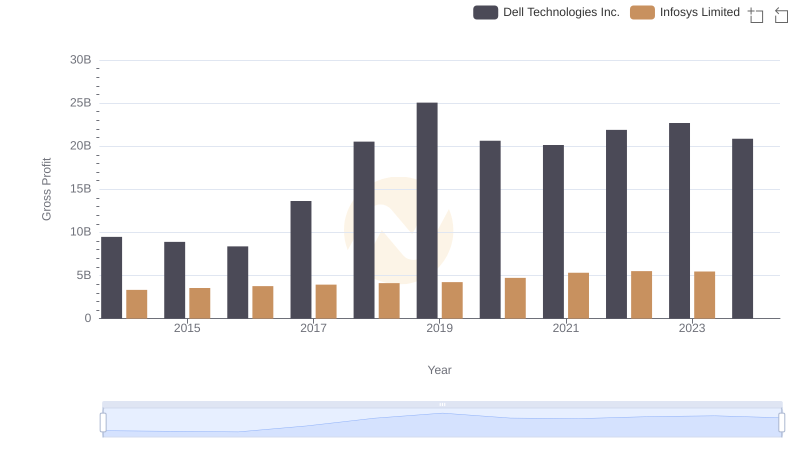
Gross Profit Trends Compared: Infosys Limited vs Dell Technologies Inc.
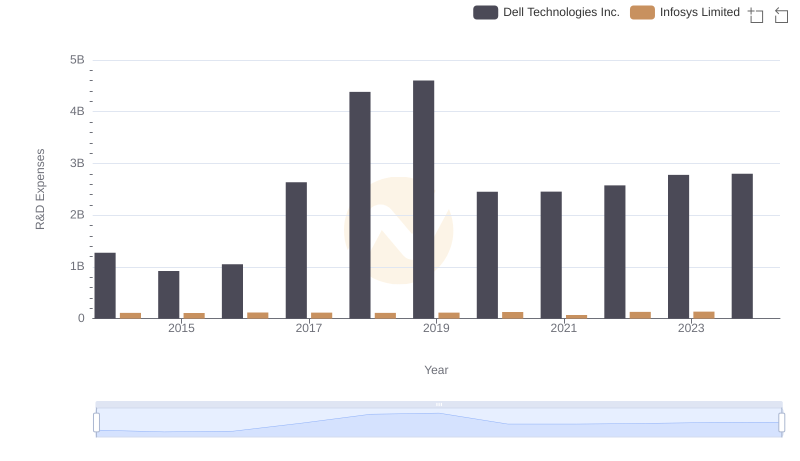
Research and Development Investment: Infosys Limited vs Dell Technologies Inc.
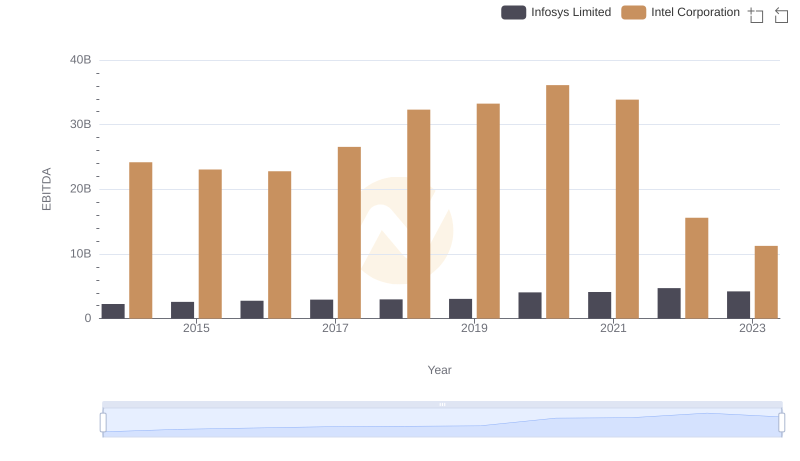
EBITDA Performance Review: Infosys Limited vs Intel Corporation
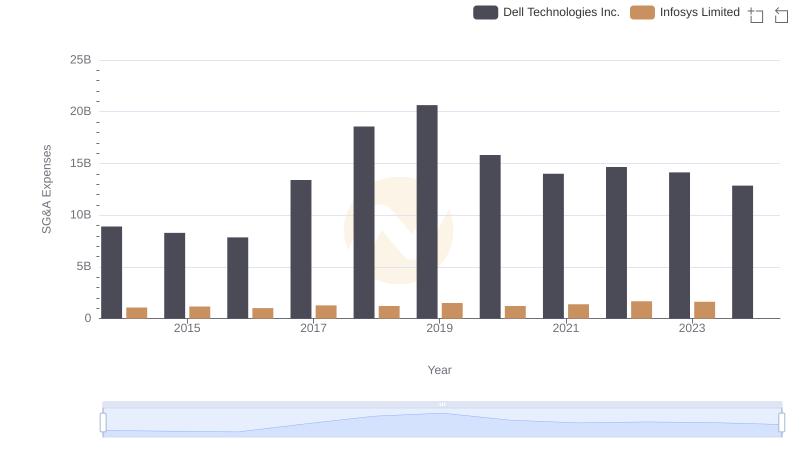
Infosys Limited or Dell Technologies Inc.: Who Manages SG&A Costs Better?
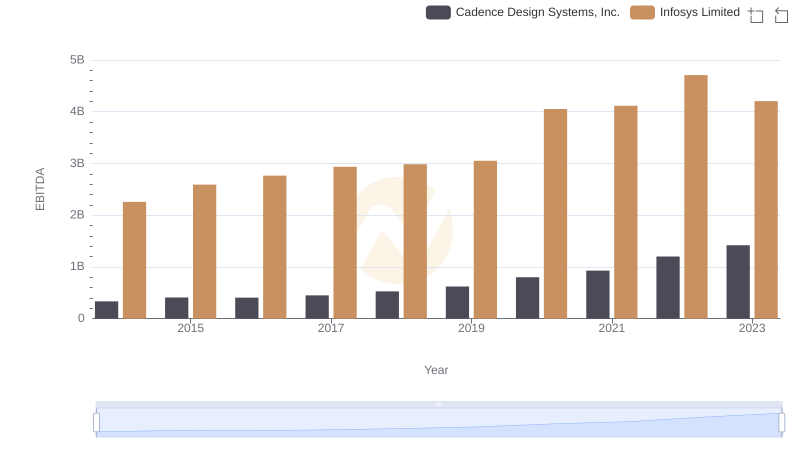
Comparative EBITDA Analysis: Infosys Limited vs Cadence Design Systems, Inc.
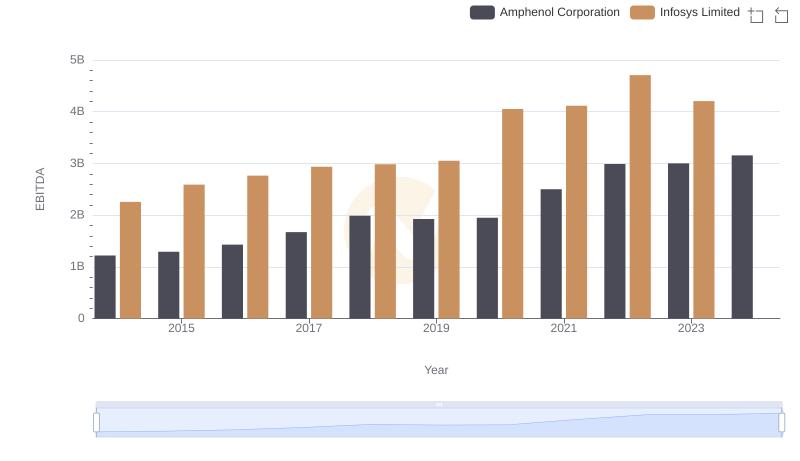
A Side-by-Side Analysis of EBITDA: Infosys Limited and Amphenol Corporation
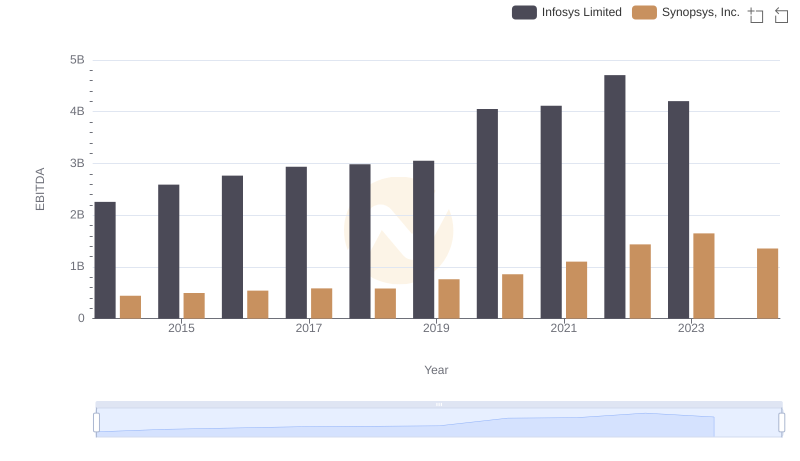
EBITDA Performance Review: Infosys Limited vs Synopsys, Inc.
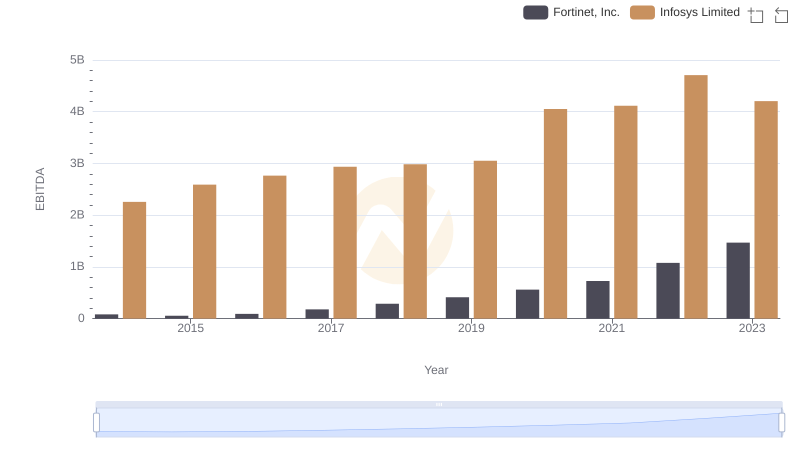
EBITDA Metrics Evaluated: Infosys Limited vs Fortinet, Inc.
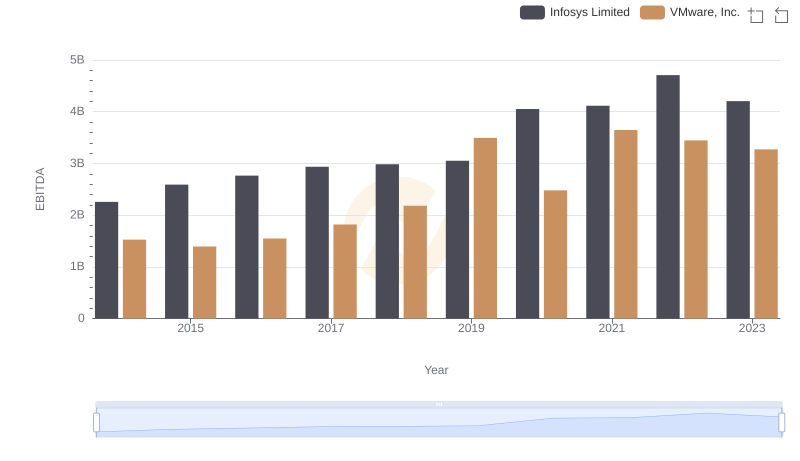
Comprehensive EBITDA Comparison: Infosys Limited vs VMware, Inc.
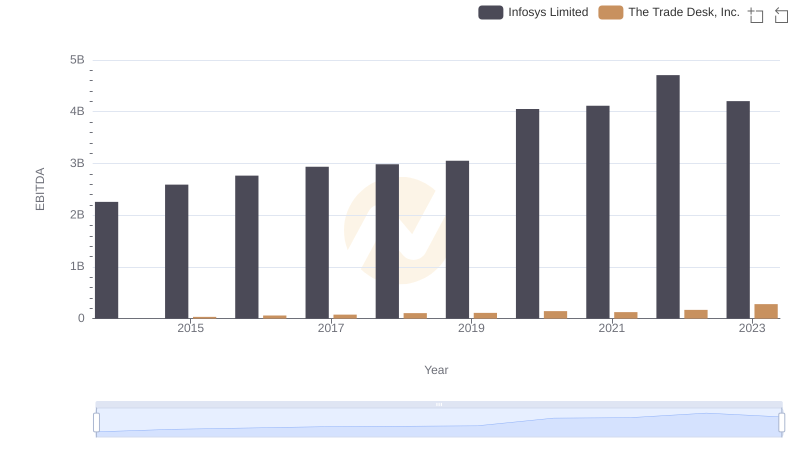
Infosys Limited and The Trade Desk, Inc.: A Detailed Examination of EBITDA Performance