| __timestamp | Eaton Corporation plc | TransUnion |
|---|---|---|
| Wednesday, January 1, 2014 | 6906000000 | 805600000 |
| Thursday, January 1, 2015 | 6563000000 | 975200000 |
| Friday, January 1, 2016 | 6347000000 | 1125800000 |
| Sunday, January 1, 2017 | 6648000000 | 1288100000 |
| Monday, January 1, 2018 | 7098000000 | 1527100000 |
| Tuesday, January 1, 2019 | 7052000000 | 1782000000 |
| Wednesday, January 1, 2020 | 5450000000 | 1796200000 |
| Friday, January 1, 2021 | 6335000000 | 1968600000 |
| Saturday, January 1, 2022 | 6887000000 | 2487000000 |
| Sunday, January 1, 2023 | 8433000000 | 2313900000 |
| Monday, January 1, 2024 | 9503000000 | 4183800000 |
Infusing magic into the data realm
In the ever-evolving landscape of global business, Eaton Corporation plc and TransUnion stand as titans in their respective industries. Over the past decade, Eaton has consistently demonstrated robust growth, with its gross profit peaking at approximately $8.4 billion in 2023, marking a 22% increase from 2014. This growth trajectory underscores Eaton's strategic prowess in the industrial sector.
Conversely, TransUnion, a leader in the information services industry, has shown remarkable resilience and expansion. From 2014 to 2023, TransUnion's gross profit surged by over 187%, reaching around $2.3 billion. This impressive growth highlights the increasing demand for data-driven insights in today's digital age.
While Eaton's profits dipped in 2020, likely due to global disruptions, both companies have rebounded strongly, showcasing their adaptability and strategic foresight. These trends offer a fascinating glimpse into the dynamic interplay of industrial and information sectors.
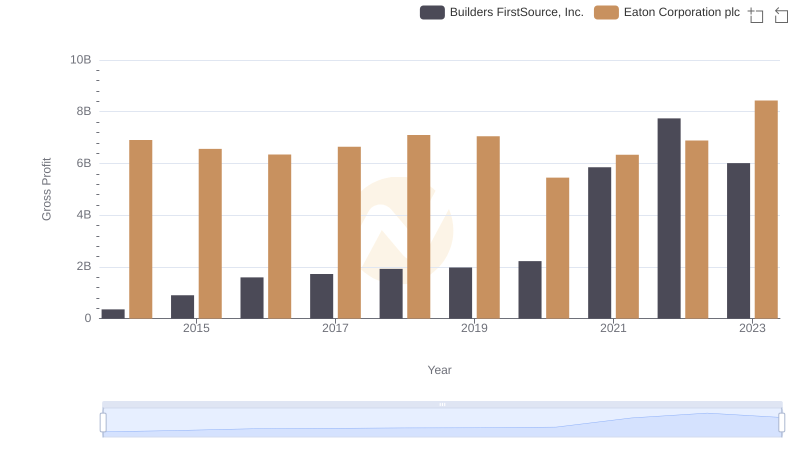
Eaton Corporation plc and Builders FirstSource, Inc.: A Detailed Gross Profit Analysis
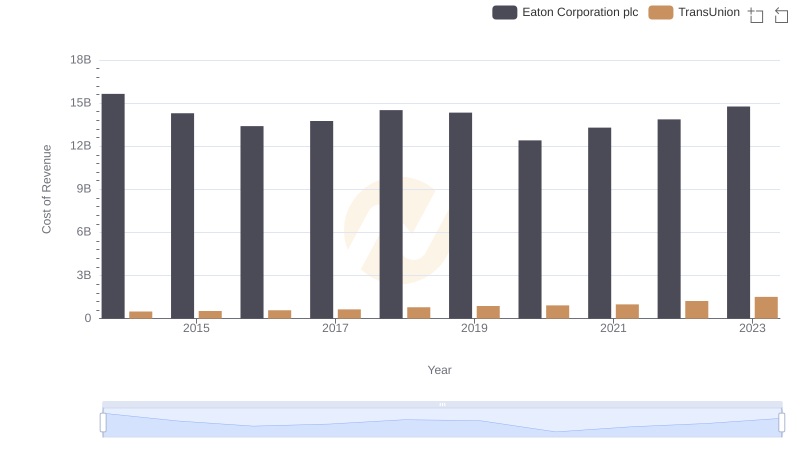
Cost of Revenue Trends: Eaton Corporation plc vs TransUnion
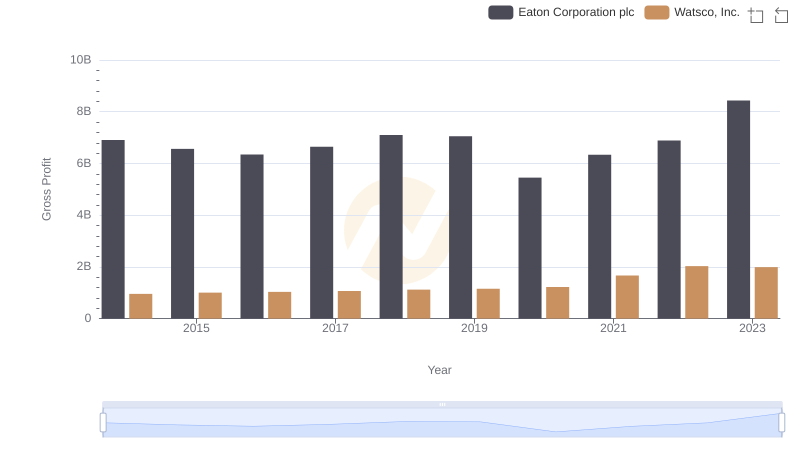
Eaton Corporation plc and Watsco, Inc.: A Detailed Gross Profit Analysis
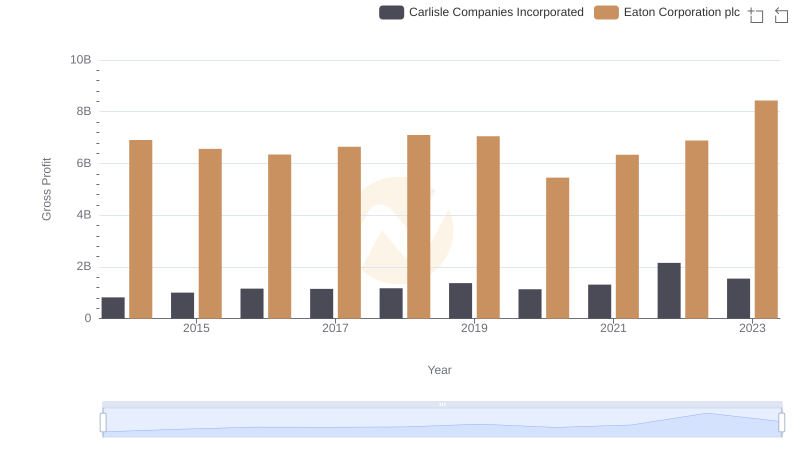
Gross Profit Comparison: Eaton Corporation plc and Carlisle Companies Incorporated Trends
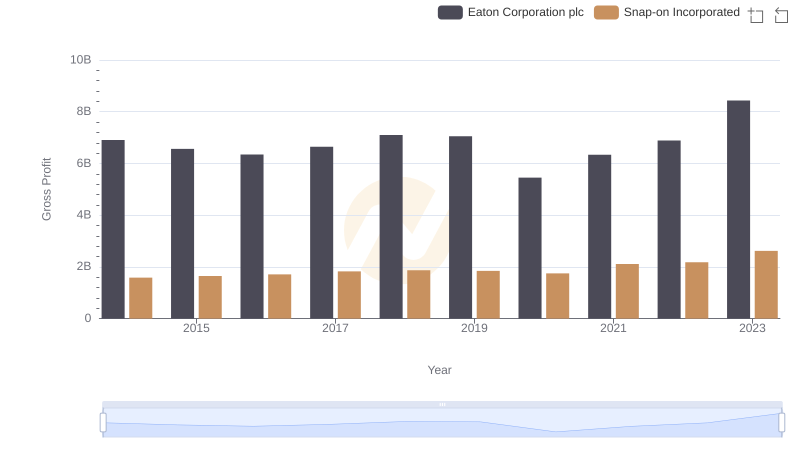
Eaton Corporation plc vs Snap-on Incorporated: A Gross Profit Performance Breakdown

Eaton Corporation plc and Masco Corporation: A Detailed Gross Profit Analysis
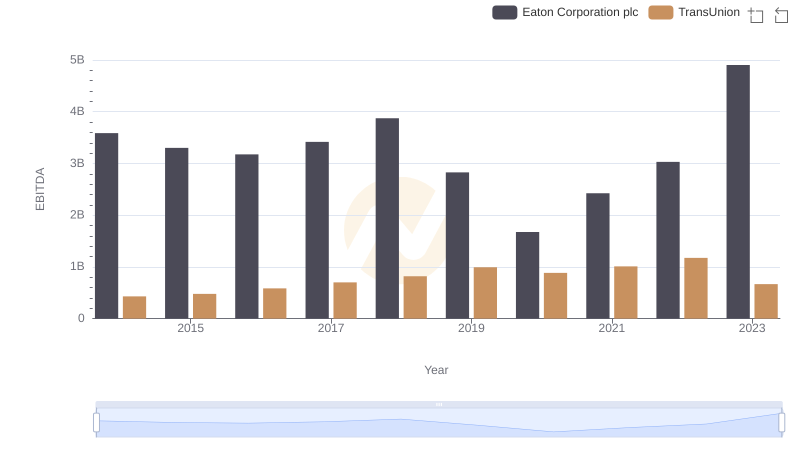
Eaton Corporation plc vs TransUnion: In-Depth EBITDA Performance Comparison