| __timestamp | Eaton Corporation plc | TransUnion |
|---|---|---|
| Wednesday, January 1, 2014 | 3586000000 | 429400000 |
| Thursday, January 1, 2015 | 3302000000 | 478200000 |
| Friday, January 1, 2016 | 3176000000 | 585300000 |
| Sunday, January 1, 2017 | 3418000000 | 701100000 |
| Monday, January 1, 2018 | 3875000000 | 819800000 |
| Tuesday, January 1, 2019 | 2827000000 | 993200000 |
| Wednesday, January 1, 2020 | 1674000000 | 883400000 |
| Friday, January 1, 2021 | 2423000000 | 1010500000 |
| Saturday, January 1, 2022 | 3031000000 | 1173800000 |
| Sunday, January 1, 2023 | 4904000000 | 667300000 |
| Monday, January 1, 2024 | 5547999771 | 1204100000 |
Unleashing insights
In the ever-evolving landscape of global business, Eaton Corporation plc and TransUnion stand as titans in their respective fields. Over the past decade, Eaton has consistently outperformed TransUnion in terms of EBITDA, showcasing a robust growth trajectory. From 2014 to 2023, Eaton's EBITDA surged by approximately 37%, peaking in 2023 with a remarkable 4.9 billion. In contrast, TransUnion's EBITDA, while showing a steady increase, reached its zenith in 2022 with 1.17 billion, marking a 173% growth from its 2014 figures.
Eaton's strategic expansions and innovations have propelled its financial performance, particularly evident in the 2023 spike. Meanwhile, TransUnion's steady climb reflects its resilience and adaptability in the financial services sector. This comparison not only highlights the financial prowess of these corporations but also underscores the dynamic nature of global markets.
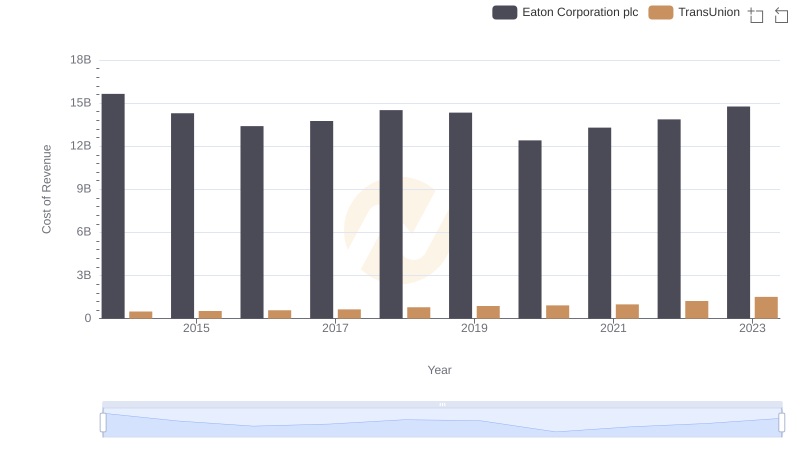
Cost of Revenue Trends: Eaton Corporation plc vs TransUnion
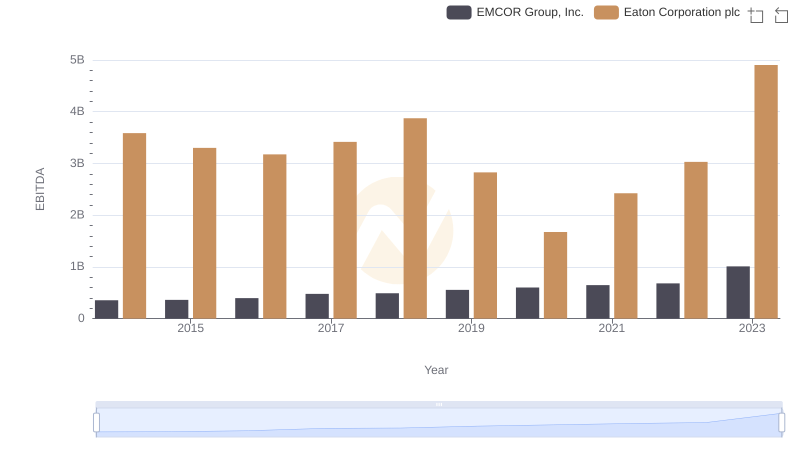
Eaton Corporation plc and EMCOR Group, Inc.: A Detailed Examination of EBITDA Performance
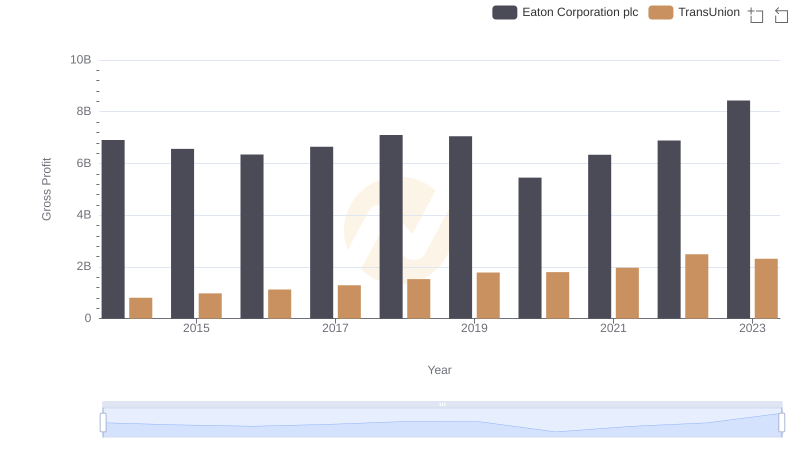
Gross Profit Trends Compared: Eaton Corporation plc vs TransUnion
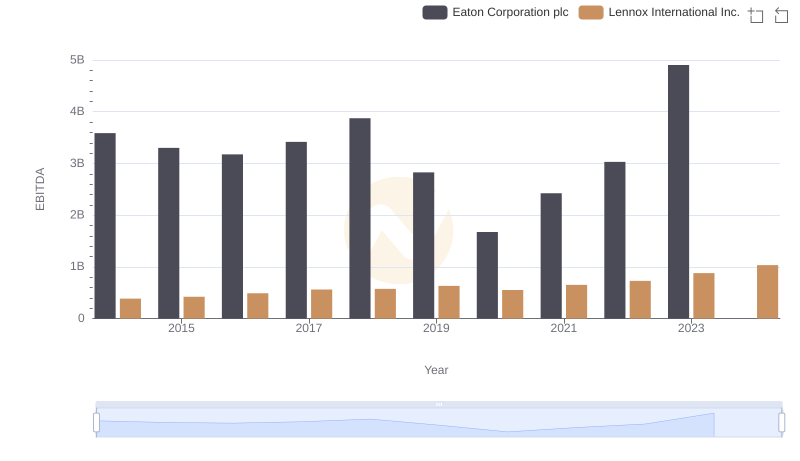
Eaton Corporation plc vs Lennox International Inc.: In-Depth EBITDA Performance Comparison
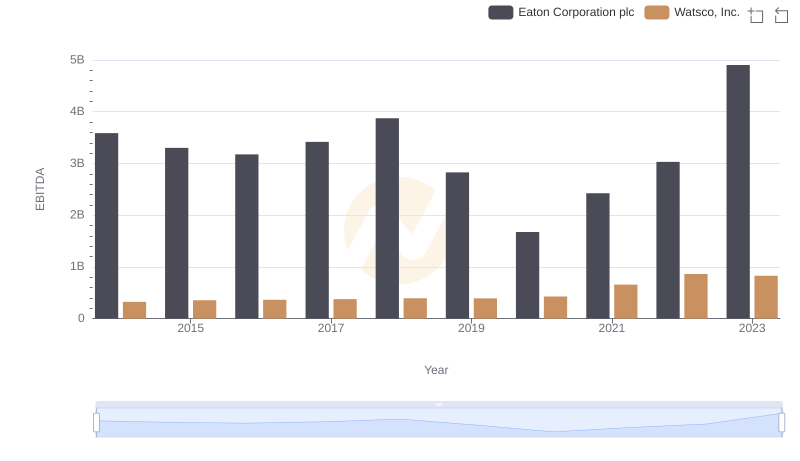
Professional EBITDA Benchmarking: Eaton Corporation plc vs Watsco, Inc.
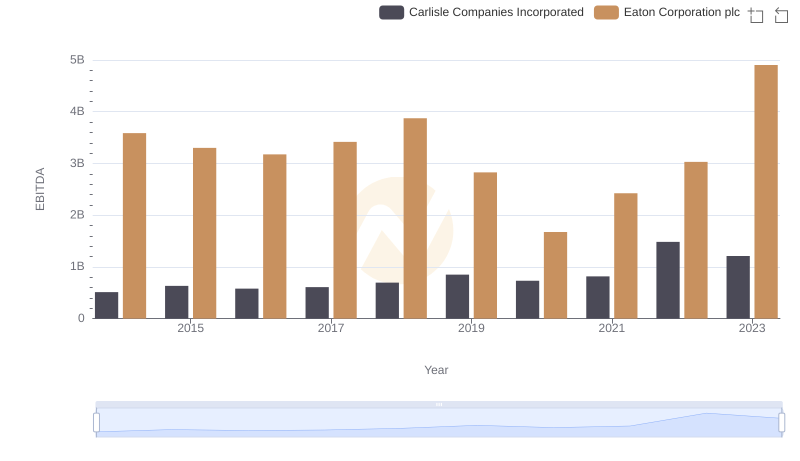
Comprehensive EBITDA Comparison: Eaton Corporation plc vs Carlisle Companies Incorporated