| __timestamp | Builders FirstSource, Inc. | Eaton Corporation plc |
|---|---|---|
| Wednesday, January 1, 2014 | 356997000 | 6906000000 |
| Thursday, January 1, 2015 | 901458000 | 6563000000 |
| Friday, January 1, 2016 | 1596748000 | 6347000000 |
| Sunday, January 1, 2017 | 1727391000 | 6648000000 |
| Monday, January 1, 2018 | 1922940000 | 7098000000 |
| Tuesday, January 1, 2019 | 1976829000 | 7052000000 |
| Wednesday, January 1, 2020 | 2222584000 | 5450000000 |
| Friday, January 1, 2021 | 5850956000 | 6335000000 |
| Saturday, January 1, 2022 | 7744379000 | 6887000000 |
| Sunday, January 1, 2023 | 6012334000 | 8433000000 |
| Monday, January 1, 2024 | 9503000000 |
In pursuit of knowledge
In the ever-evolving landscape of industrial and construction sectors, understanding financial performance is crucial. This analysis delves into the gross profit trends of Eaton Corporation plc and Builders FirstSource, Inc. from 2014 to 2023. Over this period, Eaton Corporation consistently demonstrated robust financial health, with gross profits peaking at approximately $8.4 billion in 2023, marking a 22% increase from 2014. Meanwhile, Builders FirstSource, Inc. showcased remarkable growth, with gross profits surging by over 1600%, from $357 million in 2014 to $7.7 billion in 2022. This dramatic rise underscores the company's strategic advancements and market adaptability. The data reveals a compelling narrative of growth and resilience, offering valuable insights for investors and industry analysts alike.
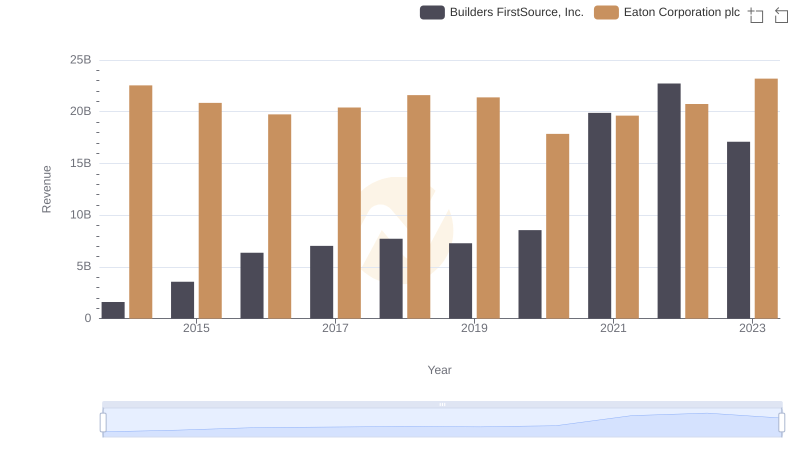
Eaton Corporation plc or Builders FirstSource, Inc.: Who Leads in Yearly Revenue?
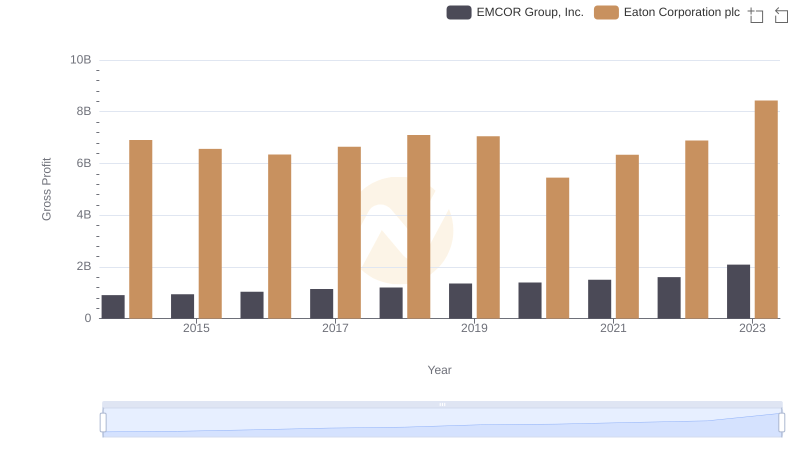
Eaton Corporation plc vs EMCOR Group, Inc.: A Gross Profit Performance Breakdown
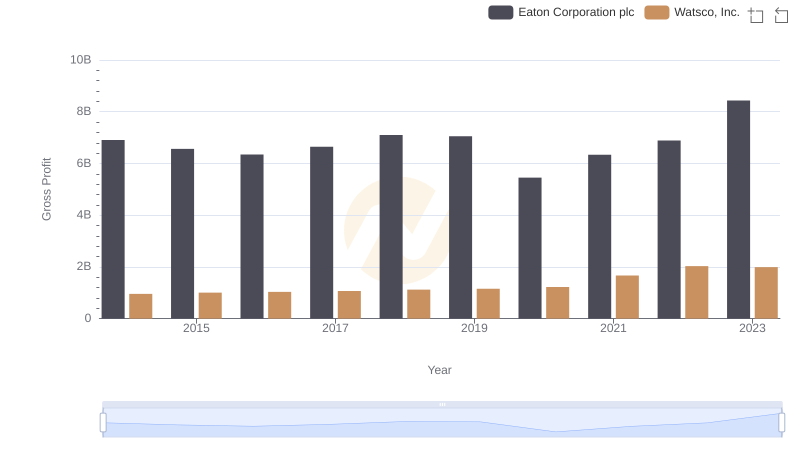
Eaton Corporation plc and Watsco, Inc.: A Detailed Gross Profit Analysis
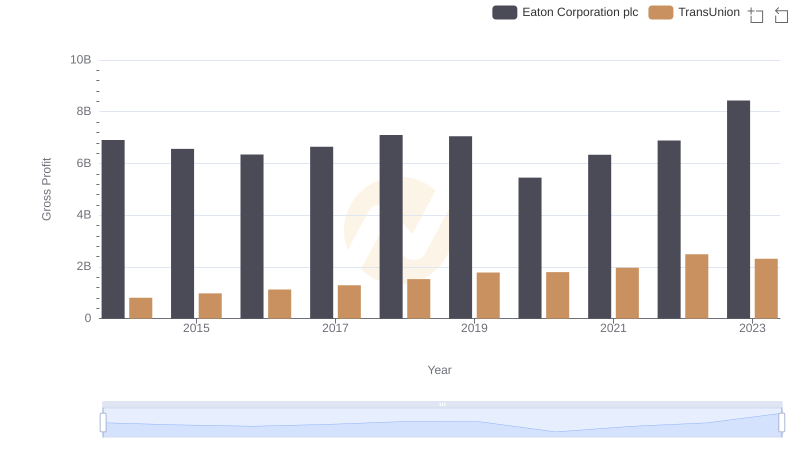
Gross Profit Trends Compared: Eaton Corporation plc vs TransUnion
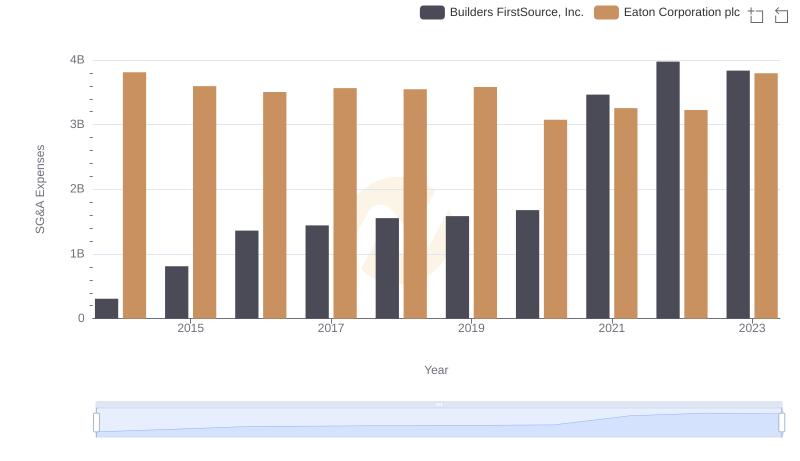
Cost Management Insights: SG&A Expenses for Eaton Corporation plc and Builders FirstSource, Inc.
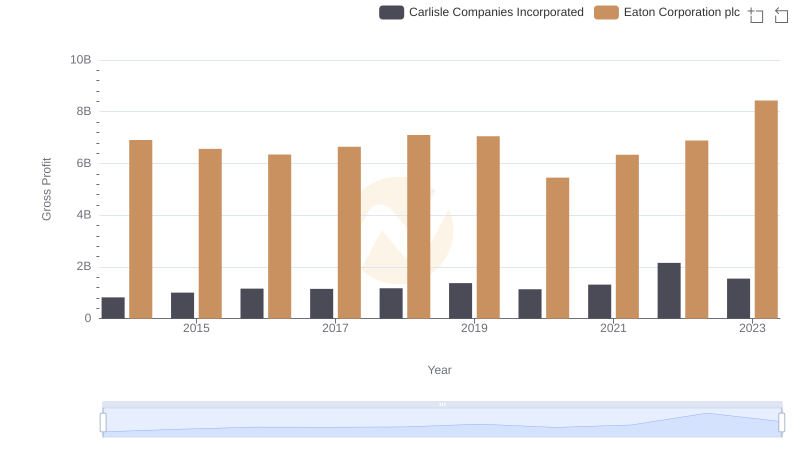
Gross Profit Comparison: Eaton Corporation plc and Carlisle Companies Incorporated Trends