| __timestamp | Eaton Corporation plc | Masco Corporation |
|---|---|---|
| Wednesday, January 1, 2014 | 6906000000 | 2387000000 |
| Thursday, January 1, 2015 | 6563000000 | 2253000000 |
| Friday, January 1, 2016 | 6347000000 | 2456000000 |
| Sunday, January 1, 2017 | 6648000000 | 2611000000 |
| Monday, January 1, 2018 | 7098000000 | 2689000000 |
| Tuesday, January 1, 2019 | 7052000000 | 2371000000 |
| Wednesday, January 1, 2020 | 5450000000 | 2587000000 |
| Friday, January 1, 2021 | 6335000000 | 2863000000 |
| Saturday, January 1, 2022 | 6887000000 | 2713000000 |
| Sunday, January 1, 2023 | 8433000000 | 2836000000 |
| Monday, January 1, 2024 | 9503000000 | 2831000000 |
In pursuit of knowledge
In the ever-evolving landscape of industrial and home improvement sectors, Eaton Corporation plc and Masco Corporation have carved out significant niches. From 2014 to 2023, Eaton's gross profit surged by approximately 22%, peaking in 2023 with a remarkable 8.4 billion. This growth trajectory underscores Eaton's resilience and strategic prowess in navigating market challenges. Meanwhile, Masco Corporation, a leader in home improvement products, demonstrated steady growth, with its gross profit increasing by around 19% over the same period, reaching nearly 2.8 billion in 2023. This consistent performance highlights Masco's ability to capitalize on the booming home renovation market. Both companies faced a dip in 2020, likely due to global disruptions, but rebounded strongly, showcasing their robust business models. As we look to the future, these trends offer valuable insights into the strategic directions of these industry titans.
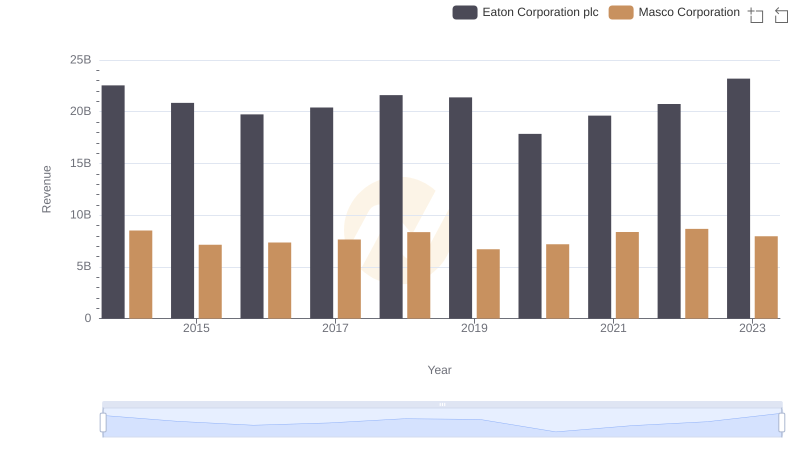
Eaton Corporation plc vs Masco Corporation: Examining Key Revenue Metrics
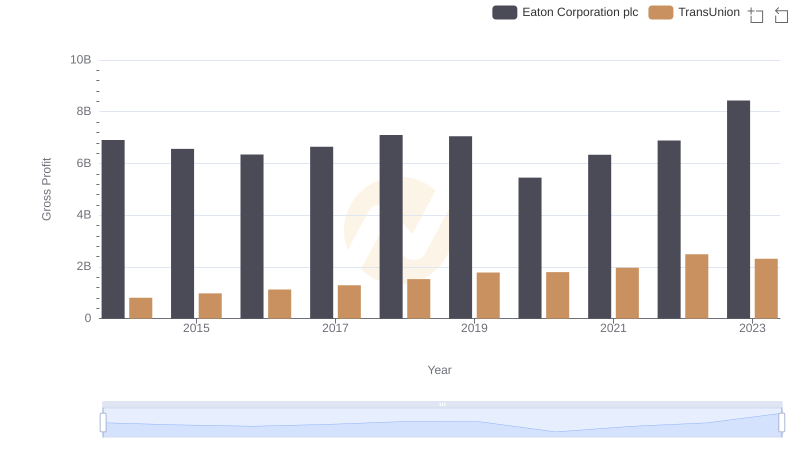
Gross Profit Trends Compared: Eaton Corporation plc vs TransUnion
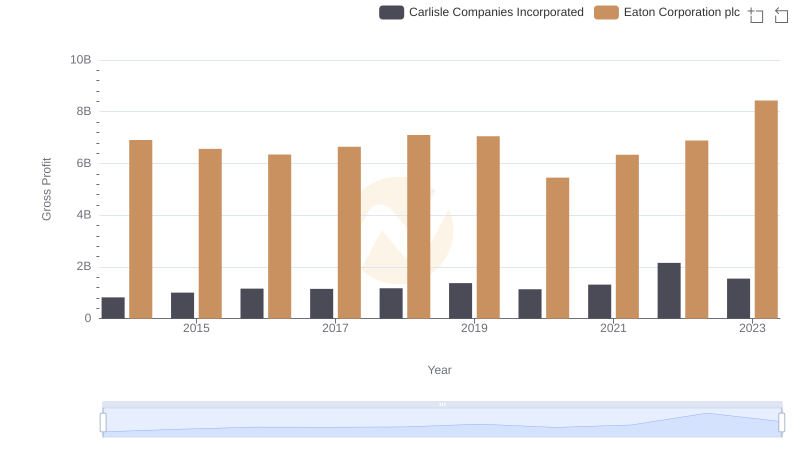
Gross Profit Comparison: Eaton Corporation plc and Carlisle Companies Incorporated Trends
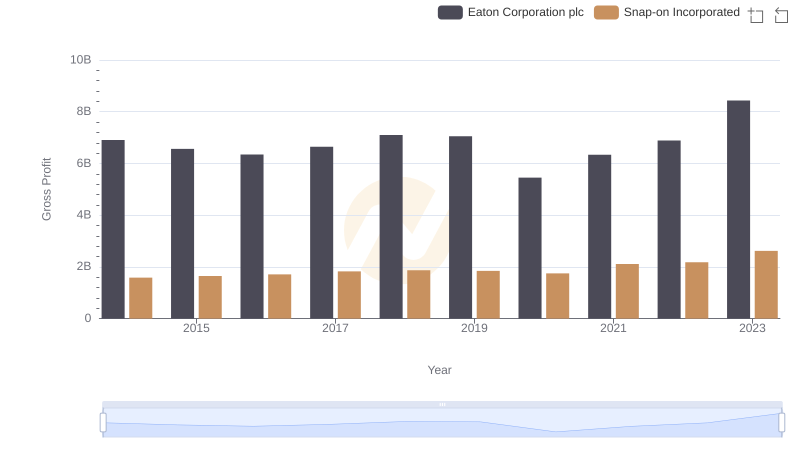
Eaton Corporation plc vs Snap-on Incorporated: A Gross Profit Performance Breakdown
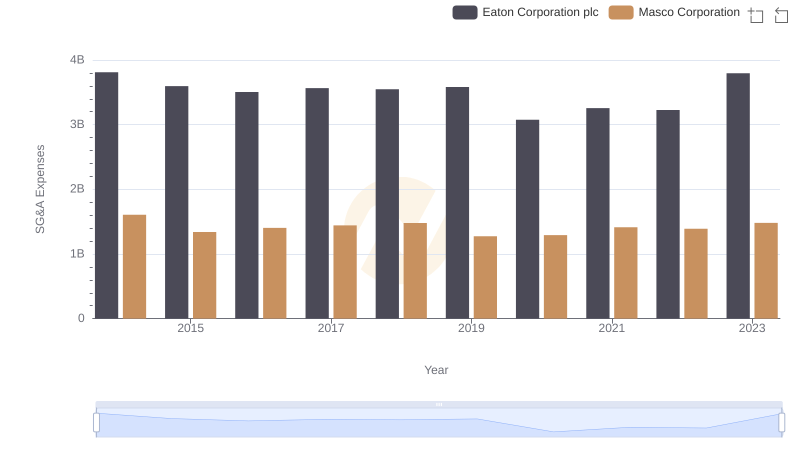
SG&A Efficiency Analysis: Comparing Eaton Corporation plc and Masco Corporation
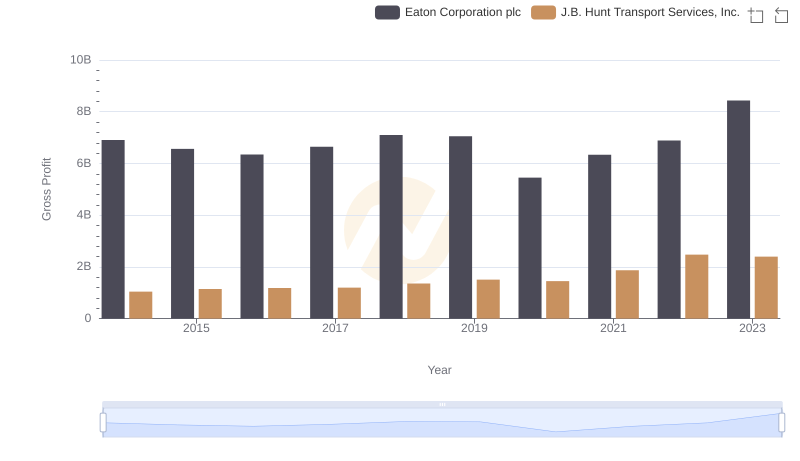
Gross Profit Comparison: Eaton Corporation plc and J.B. Hunt Transport Services, Inc. Trends