| __timestamp | Carlisle Companies Incorporated | Eaton Corporation plc |
|---|---|---|
| Wednesday, January 1, 2014 | 819500000 | 6906000000 |
| Thursday, January 1, 2015 | 1006700000 | 6563000000 |
| Friday, January 1, 2016 | 1157300000 | 6347000000 |
| Sunday, January 1, 2017 | 1148000000 | 6648000000 |
| Monday, January 1, 2018 | 1174700000 | 7098000000 |
| Tuesday, January 1, 2019 | 1371700000 | 7052000000 |
| Wednesday, January 1, 2020 | 1137400000 | 5450000000 |
| Friday, January 1, 2021 | 1314700000 | 6335000000 |
| Saturday, January 1, 2022 | 2157400000 | 6887000000 |
| Sunday, January 1, 2023 | 1544000000 | 8433000000 |
| Monday, January 1, 2024 | 1887700000 | 9503000000 |
Infusing magic into the data realm
In the ever-evolving landscape of industrial manufacturing, Eaton Corporation plc and Carlisle Companies Incorporated have emerged as key players. Over the past decade, Eaton has consistently outperformed Carlisle in terms of gross profit, showcasing a robust financial trajectory. From 2014 to 2023, Eaton's gross profit surged by approximately 22%, peaking in 2023 with a remarkable 8.4 billion USD. In contrast, Carlisle experienced a more volatile journey, with a notable spike in 2022, reaching a gross profit of 2.2 billion USD, a 90% increase from 2014. However, by 2023, Carlisle's figures slightly receded to 1.5 billion USD. This comparison highlights Eaton's steady growth and resilience, while Carlisle's performance underscores its potential for significant gains despite fluctuations. As the industrial sector continues to adapt to global challenges, these trends offer valuable insights into the strategic maneuvers of these industry giants.
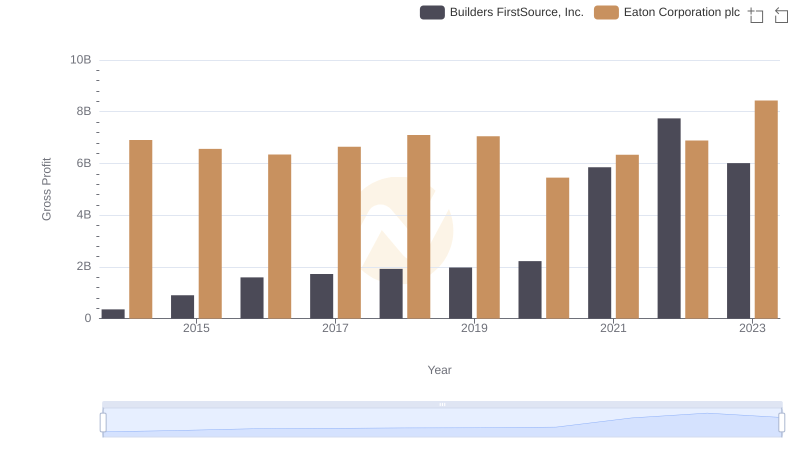
Eaton Corporation plc and Builders FirstSource, Inc.: A Detailed Gross Profit Analysis
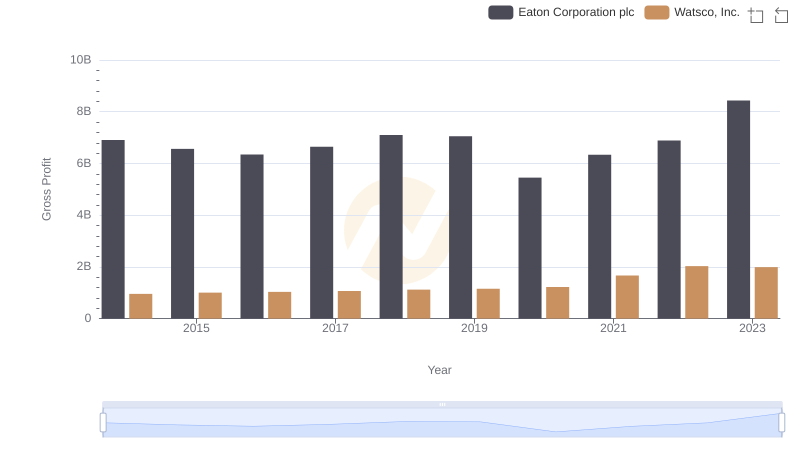
Eaton Corporation plc and Watsco, Inc.: A Detailed Gross Profit Analysis
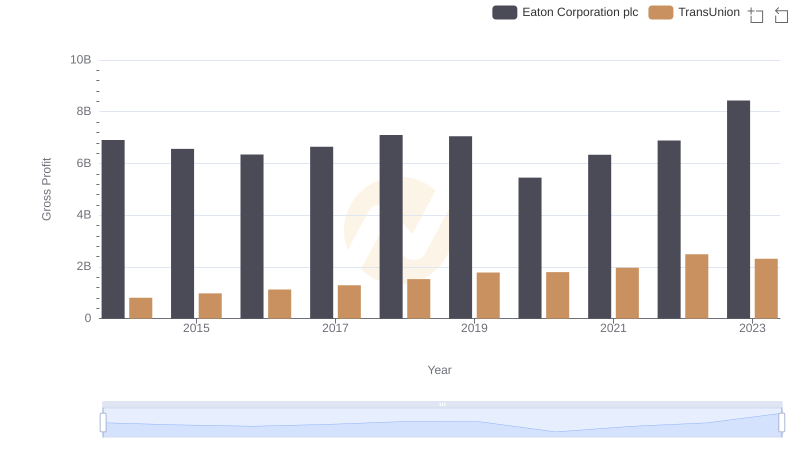
Gross Profit Trends Compared: Eaton Corporation plc vs TransUnion
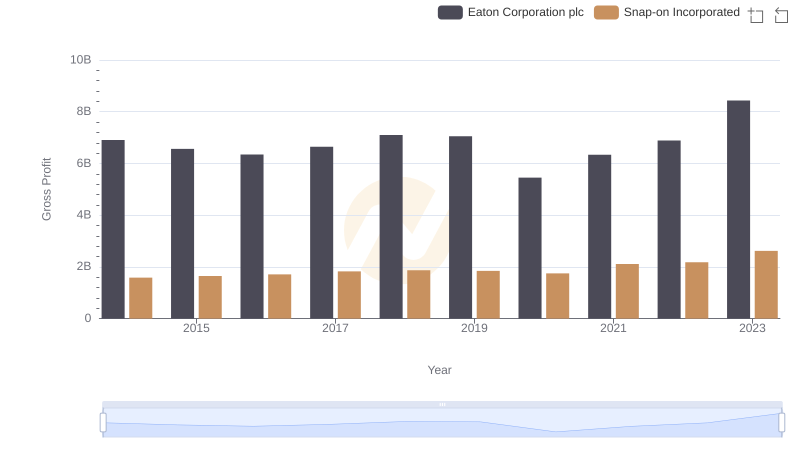
Eaton Corporation plc vs Snap-on Incorporated: A Gross Profit Performance Breakdown

Eaton Corporation plc and Masco Corporation: A Detailed Gross Profit Analysis
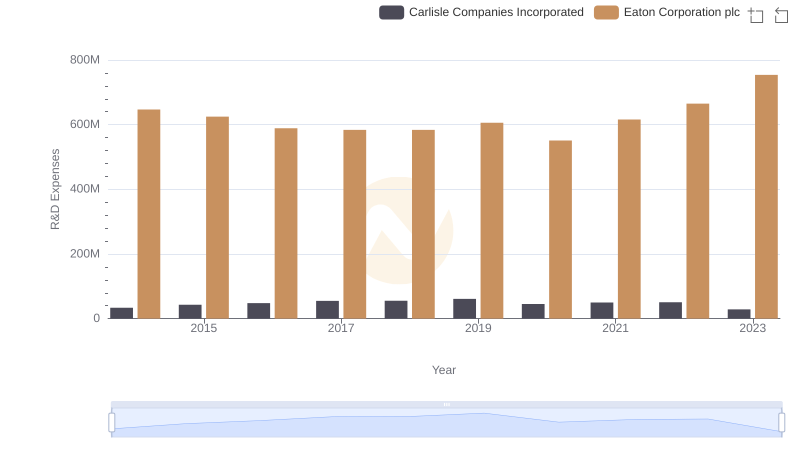
R&D Insights: How Eaton Corporation plc and Carlisle Companies Incorporated Allocate Funds
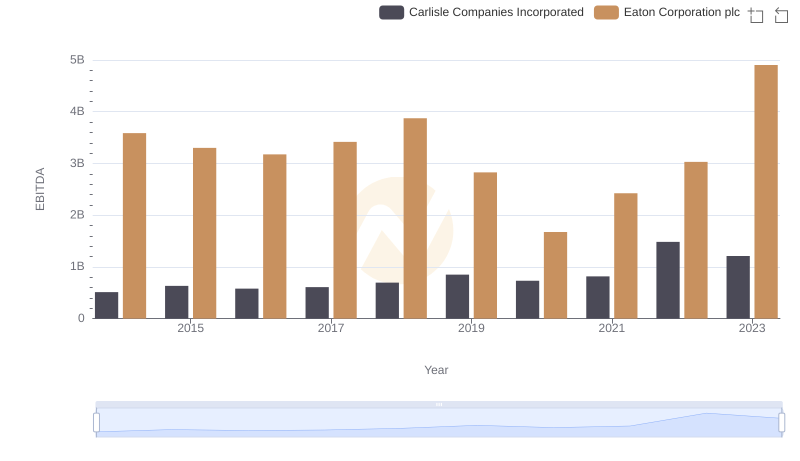
Comprehensive EBITDA Comparison: Eaton Corporation plc vs Carlisle Companies Incorporated