| __timestamp | Cintas Corporation | Northrop Grumman Corporation |
|---|---|---|
| Wednesday, January 1, 2014 | 1914386000 | 5601000000 |
| Thursday, January 1, 2015 | 1921337000 | 5642000000 |
| Friday, January 1, 2016 | 2129870000 | 5777000000 |
| Sunday, January 1, 2017 | 2380295000 | 5954000000 |
| Monday, January 1, 2018 | 2908523000 | 6791000000 |
| Tuesday, January 1, 2019 | 3128588000 | 7259000000 |
| Wednesday, January 1, 2020 | 3233748000 | 7478000000 |
| Friday, January 1, 2021 | 3314651000 | 7268000000 |
| Saturday, January 1, 2022 | 3632246000 | 7474000000 |
| Sunday, January 1, 2023 | 4173368000 | 6551000000 |
| Monday, January 1, 2024 | 4686416000 | 8362000000 |
Cracking the code
In the ever-evolving landscape of American industry, Cintas Corporation and Northrop Grumman Corporation stand as titans in their respective fields. Over the past decade, Cintas, a leader in corporate uniforms and facility services, has seen its gross profit soar by over 145%, from approximately $1.9 billion in 2014 to an impressive $4.7 billion in 2024. This growth reflects a robust expansion strategy and a keen focus on operational efficiency.
Meanwhile, Northrop Grumman, a key player in the defense and aerospace sector, experienced a steady increase in gross profit, peaking at around $7.5 billion in 2020. However, recent years have shown a slight decline, with 2023 figures dropping to $6.6 billion. This fluctuation may be attributed to shifting defense budgets and global market dynamics.
The data reveals a compelling narrative of growth and adaptation, underscoring the resilience and strategic prowess of these industry leaders.
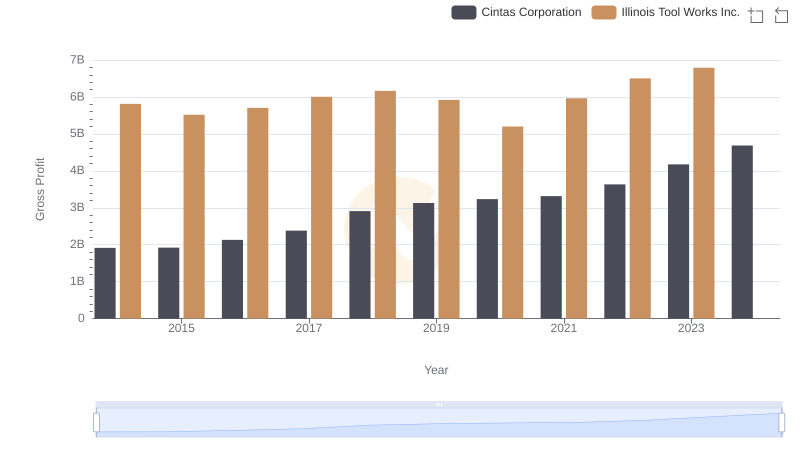
Key Insights on Gross Profit: Cintas Corporation vs Illinois Tool Works Inc.
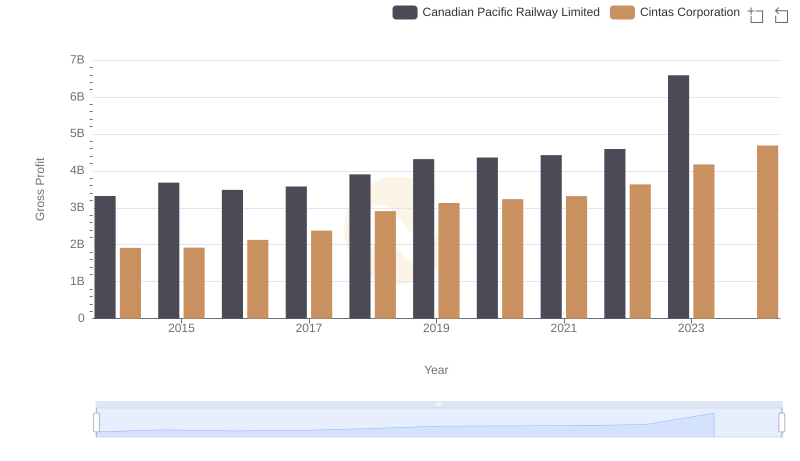
Gross Profit Comparison: Cintas Corporation and Canadian Pacific Railway Limited Trends
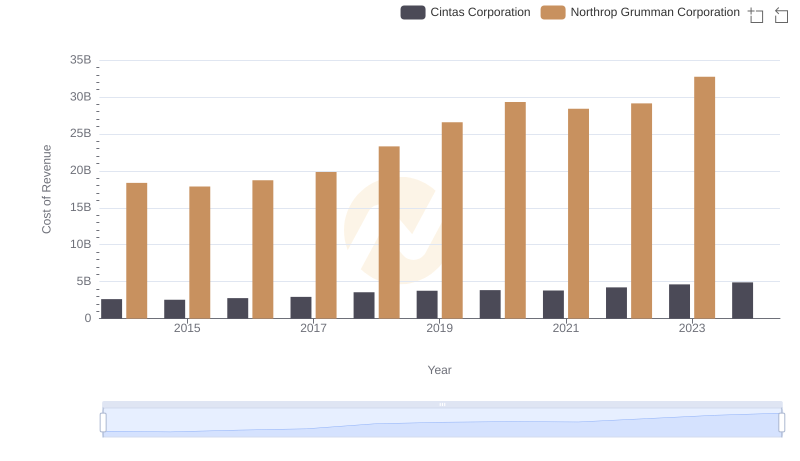
Cost of Revenue: Key Insights for Cintas Corporation and Northrop Grumman Corporation
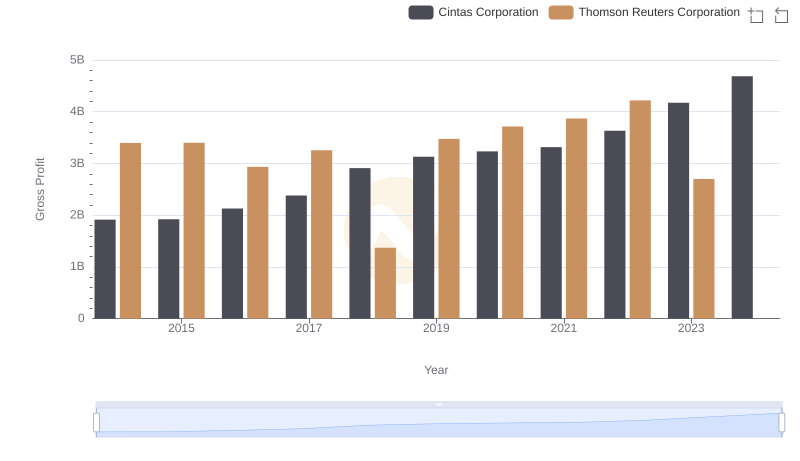
Cintas Corporation and Thomson Reuters Corporation: A Detailed Gross Profit Analysis
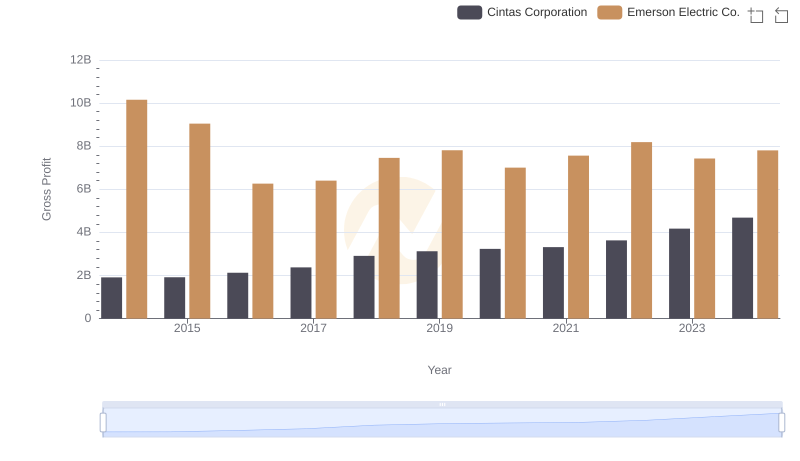
Who Generates Higher Gross Profit? Cintas Corporation or Emerson Electric Co.
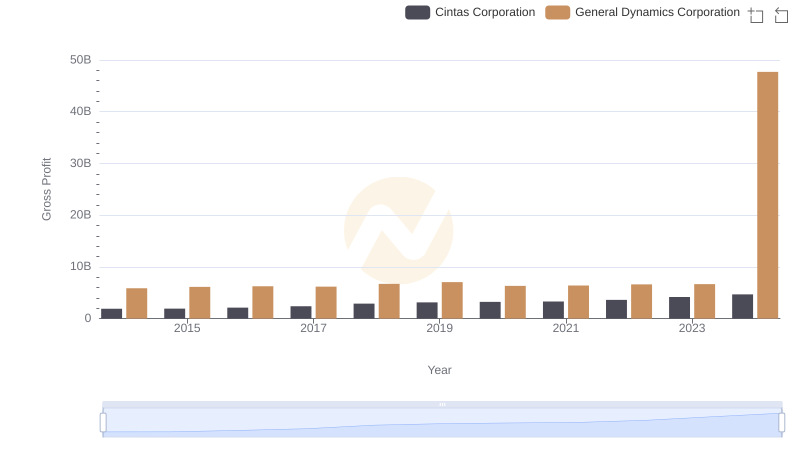
Gross Profit Trends Compared: Cintas Corporation vs General Dynamics Corporation
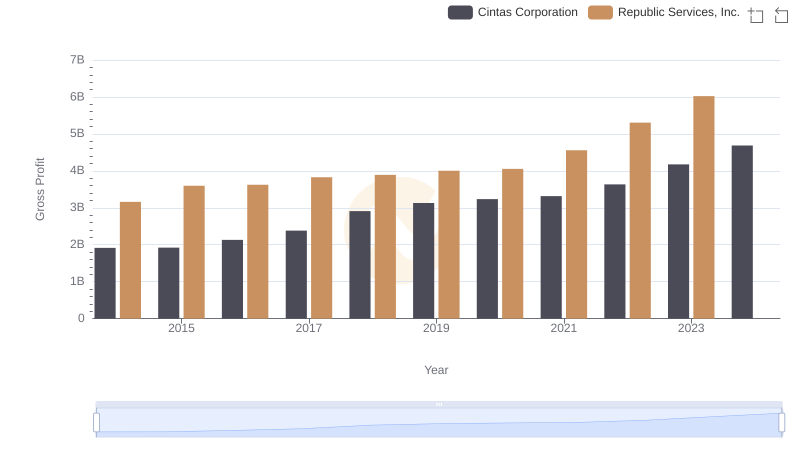
Cintas Corporation vs Republic Services, Inc.: A Gross Profit Performance Breakdown
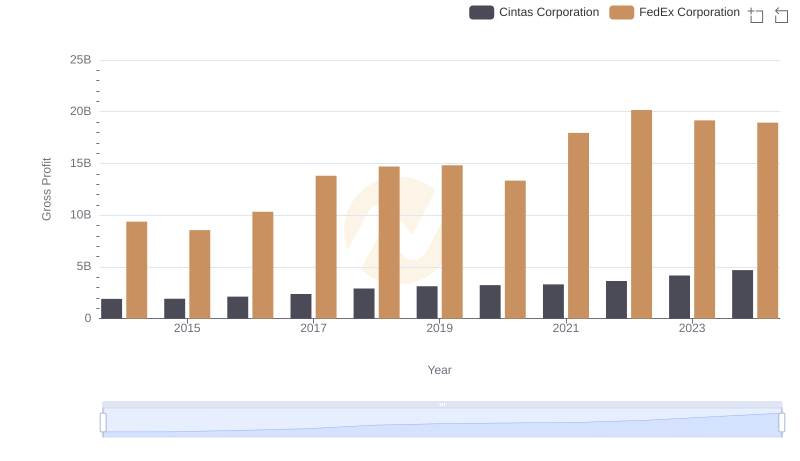
Gross Profit Comparison: Cintas Corporation and FedEx Corporation Trends
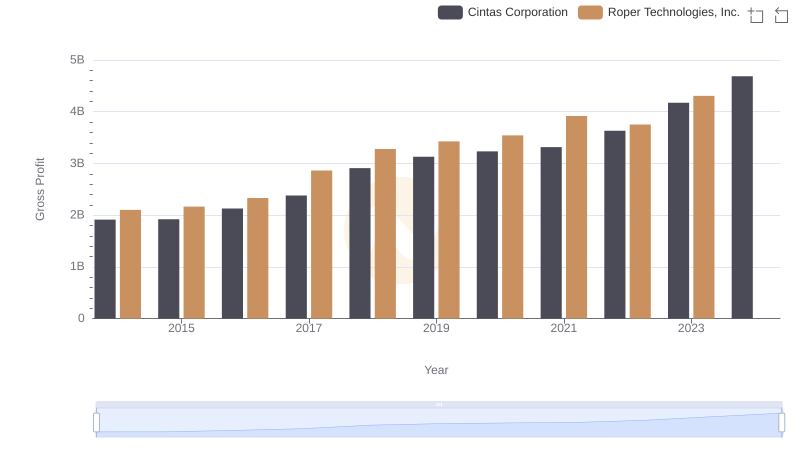
Key Insights on Gross Profit: Cintas Corporation vs Roper Technologies, Inc.
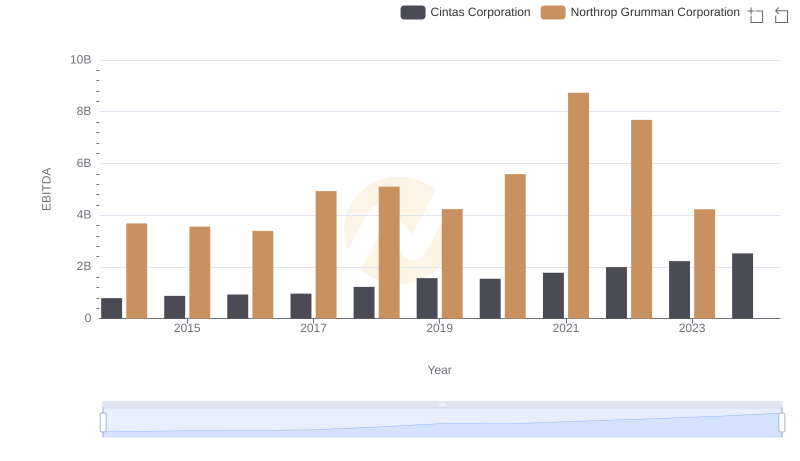
Comparative EBITDA Analysis: Cintas Corporation vs Northrop Grumman Corporation