| __timestamp | AMETEK, Inc. | Saia, Inc. |
|---|---|---|
| Wednesday, January 1, 2014 | 1424947000 | 159268000 |
| Thursday, January 1, 2015 | 1425015000 | 154120000 |
| Friday, January 1, 2016 | 1264867000 | 159502000 |
| Sunday, January 1, 2017 | 1448739000 | 175046000 |
| Monday, January 1, 2018 | 1659562000 | 230070000 |
| Tuesday, January 1, 2019 | 1787660000 | 249653000 |
| Wednesday, January 1, 2020 | 1543514000 | 283848000 |
| Friday, January 1, 2021 | 1912614000 | 451687000 |
| Saturday, January 1, 2022 | 2145269000 | 590963000 |
| Sunday, January 1, 2023 | 2384465001 | 598932000 |
| Monday, January 1, 2024 | 6941180000 |
Unleashing insights
In the ever-evolving landscape of American industry, AMETEK, Inc. and Saia, Inc. have carved distinct paths over the past decade. From 2014 to 2023, AMETEK's gross profit surged by approximately 67%, reflecting its robust growth strategy and market adaptability. In contrast, Saia, Inc. demonstrated a remarkable 276% increase in gross profit, underscoring its dynamic expansion in the logistics sector.
AMETEK, Inc.: Despite a dip in 2016, AMETEK's gross profit consistently climbed, peaking in 2023. This growth trajectory highlights its resilience and strategic investments in technology and innovation.
Saia, Inc.: Starting from a modest base, Saia's gross profit growth accelerated, particularly post-2020, as it capitalized on the e-commerce boom and supply chain demands.
This comparative analysis offers a window into the strategic maneuvers and market conditions that have shaped these companies' financial landscapes.
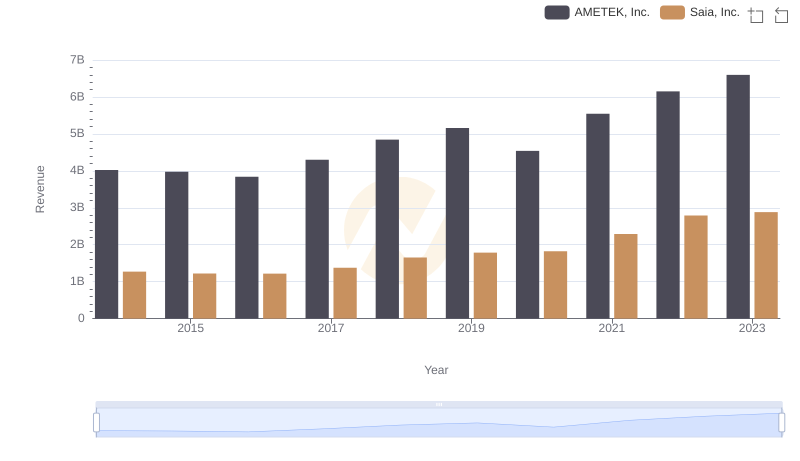
Revenue Showdown: AMETEK, Inc. vs Saia, Inc.
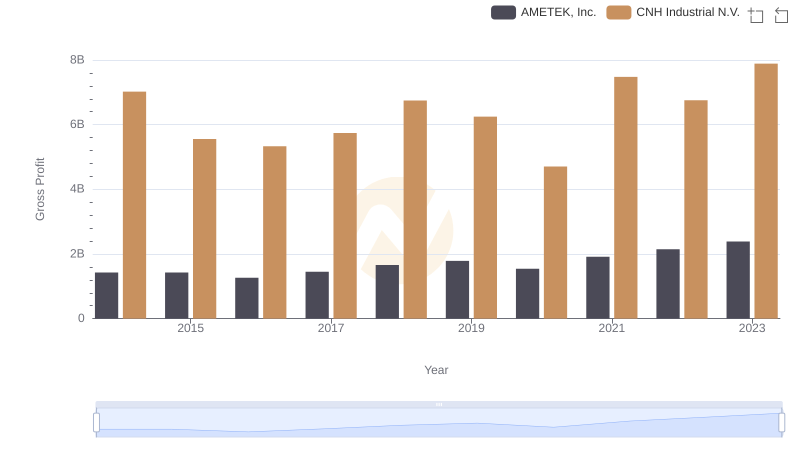
Gross Profit Trends Compared: AMETEK, Inc. vs CNH Industrial N.V.
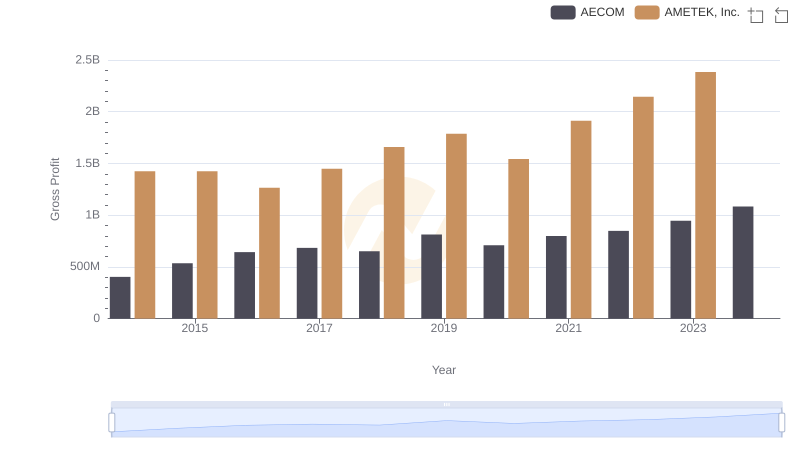
Gross Profit Trends Compared: AMETEK, Inc. vs AECOM
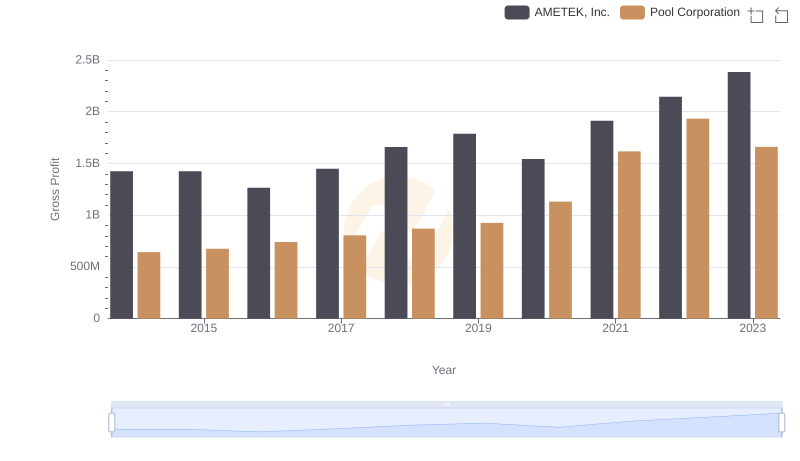
AMETEK, Inc. vs Pool Corporation: A Gross Profit Performance Breakdown
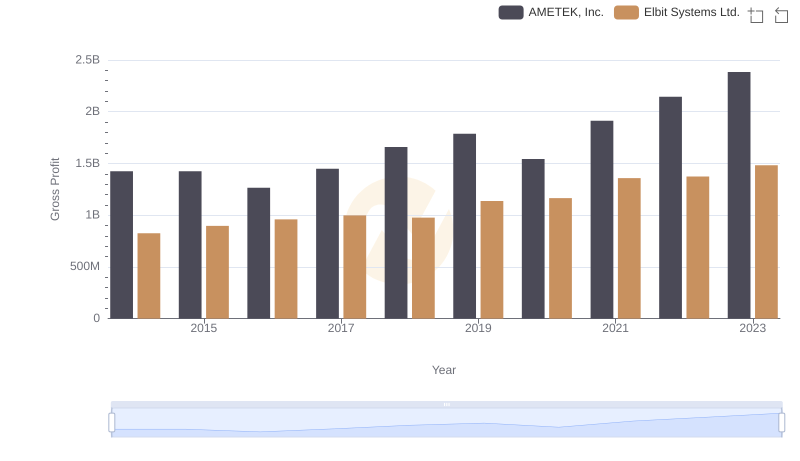
Key Insights on Gross Profit: AMETEK, Inc. vs Elbit Systems Ltd.
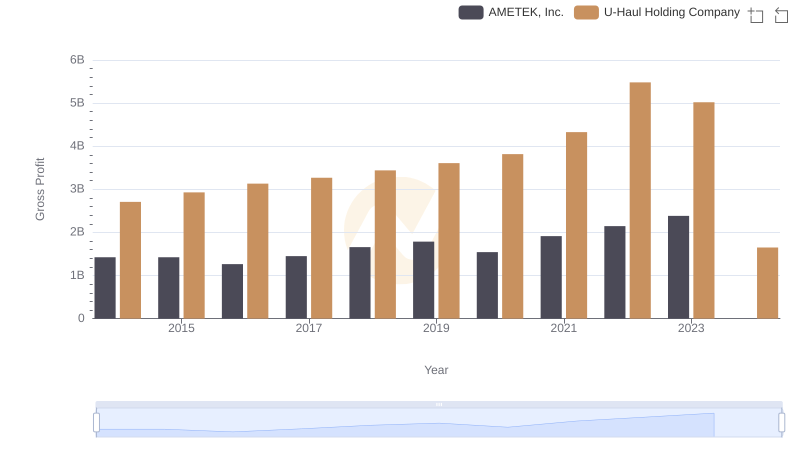
AMETEK, Inc. vs U-Haul Holding Company: A Gross Profit Performance Breakdown
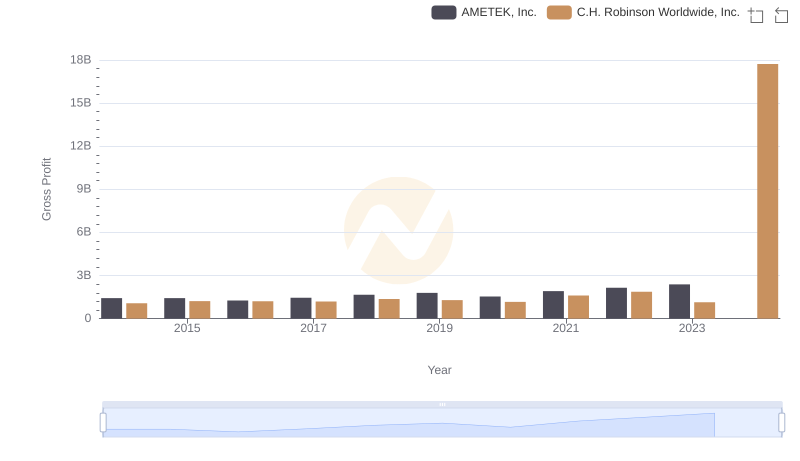
Gross Profit Analysis: Comparing AMETEK, Inc. and C.H. Robinson Worldwide, Inc.
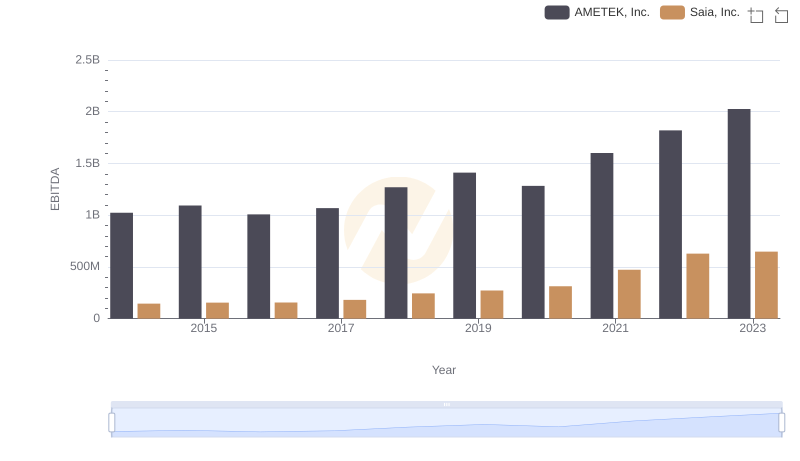
AMETEK, Inc. vs Saia, Inc.: In-Depth EBITDA Performance Comparison