| __timestamp | Ferrovial SE | Westinghouse Air Brake Technologies Corporation |
|---|---|---|
| Wednesday, January 1, 2014 | 7671000000 | 913534000 |
| Thursday, January 1, 2015 | 8556000000 | 1026153000 |
| Friday, January 1, 2016 | 9491000000 | 901541000 |
| Sunday, January 1, 2017 | 10864000000 | 1040597000 |
| Monday, January 1, 2018 | 4752000000 | 1211731000 |
| Tuesday, January 1, 2019 | 5105000000 | 2077600000 |
| Wednesday, January 1, 2020 | 5336000000 | 1898700000 |
| Friday, January 1, 2021 | 5701000000 | 2135000000 |
| Saturday, January 1, 2022 | 6354000000 | 2292000000 |
| Sunday, January 1, 2023 | 7385000000 | 2944000000 |
| Monday, January 1, 2024 | 3366000000 |
Unleashing the power of data
In the ever-evolving landscape of global business, the financial performance of industry leaders like Westinghouse Air Brake Technologies Corporation and Ferrovial SE offers a fascinating glimpse into market dynamics. Over the past decade, Ferrovial SE has consistently outperformed its counterpart, boasting an average gross profit nearly 4.3 times higher. However, Westinghouse Air Brake Technologies Corporation has shown remarkable growth, with its gross profit surging by over 220% from 2014 to 2023.
These insights underscore the dynamic nature of global markets and the strategic maneuvers companies employ to stay competitive.
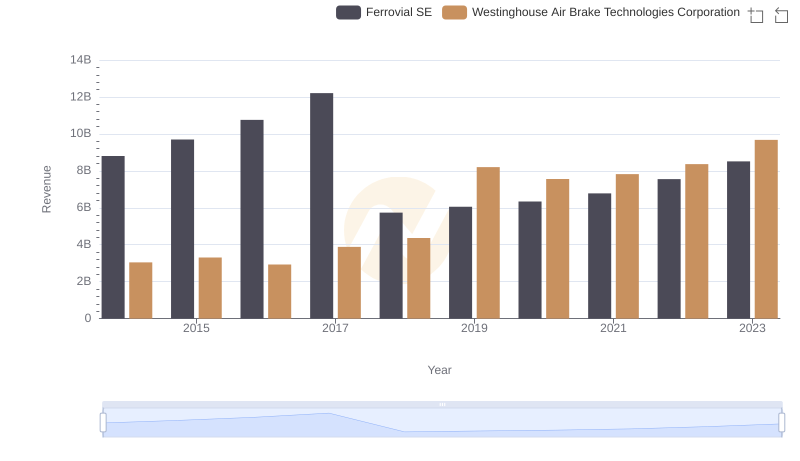
Westinghouse Air Brake Technologies Corporation vs Ferrovial SE: Annual Revenue Growth Compared
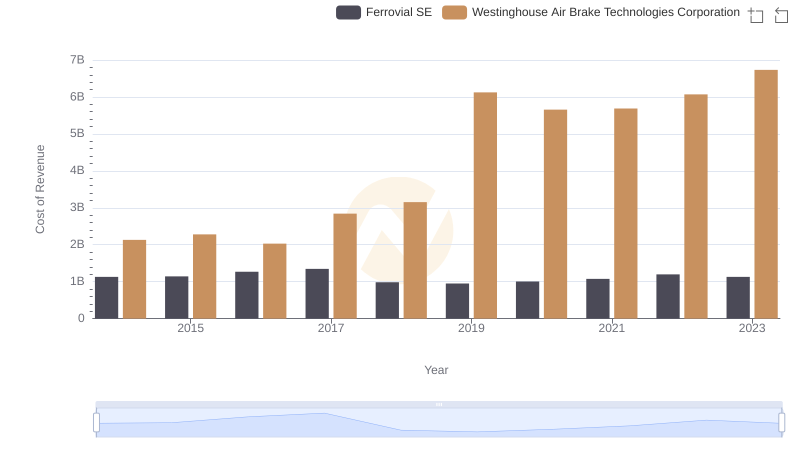
Comparing Cost of Revenue Efficiency: Westinghouse Air Brake Technologies Corporation vs Ferrovial SE
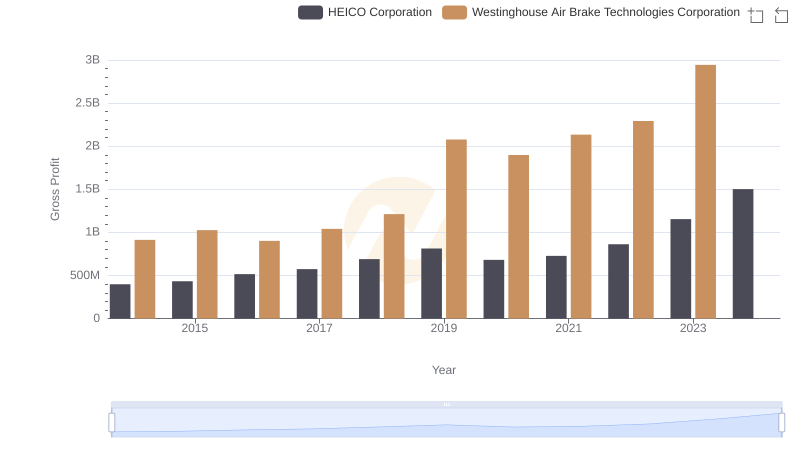
Gross Profit Comparison: Westinghouse Air Brake Technologies Corporation and HEICO Corporation Trends
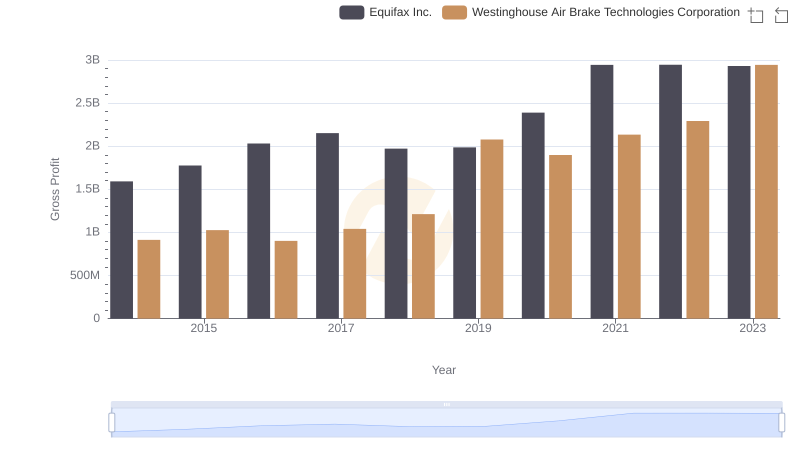
Westinghouse Air Brake Technologies Corporation vs Equifax Inc.: A Gross Profit Performance Breakdown
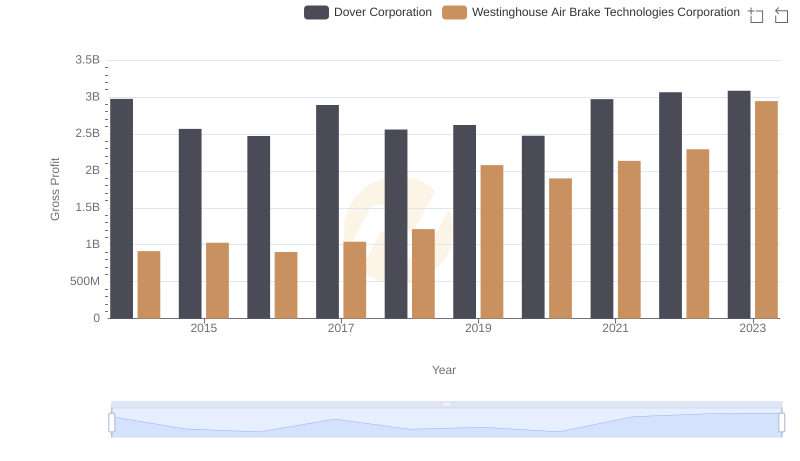
Gross Profit Comparison: Westinghouse Air Brake Technologies Corporation and Dover Corporation Trends
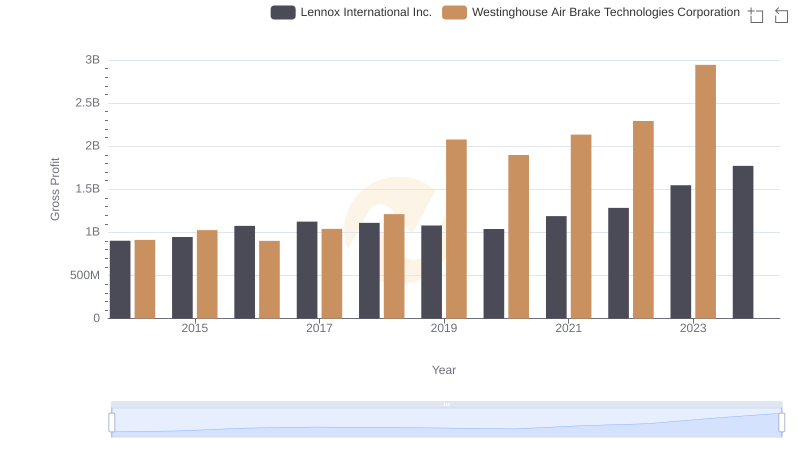
Gross Profit Comparison: Westinghouse Air Brake Technologies Corporation and Lennox International Inc. Trends
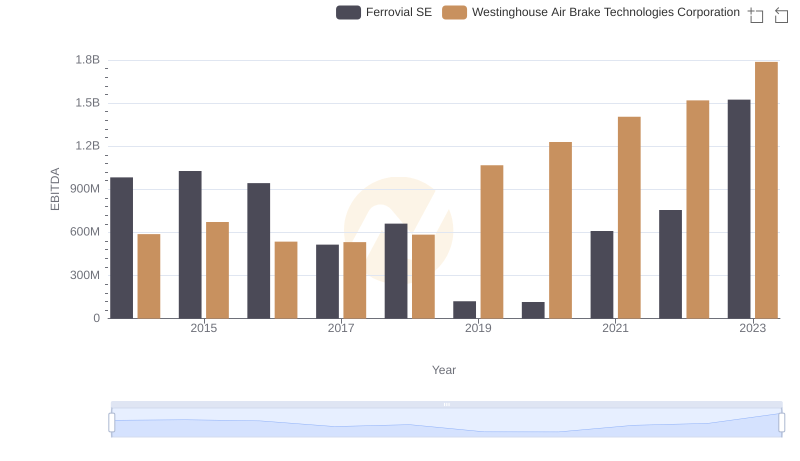
Professional EBITDA Benchmarking: Westinghouse Air Brake Technologies Corporation vs Ferrovial SE
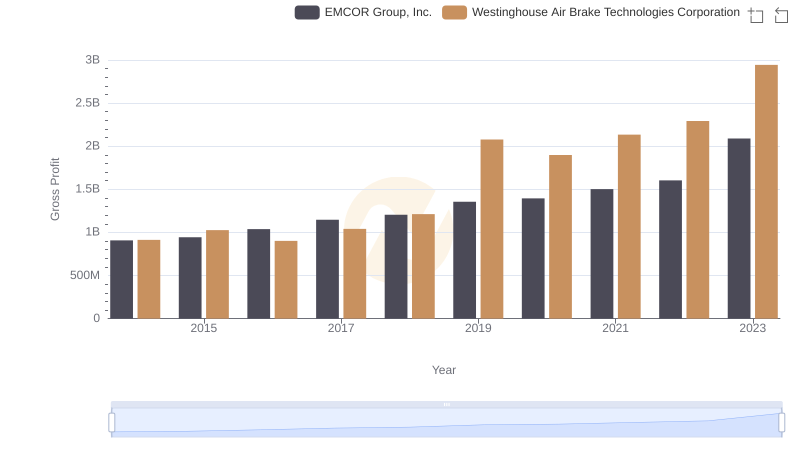
Who Generates Higher Gross Profit? Westinghouse Air Brake Technologies Corporation or EMCOR Group, Inc.