| __timestamp | Curtiss-Wright Corporation | Ingersoll Rand Inc. |
|---|---|---|
| Wednesday, January 1, 2014 | 776516000 | 936781000 |
| Thursday, January 1, 2015 | 783255000 | 779100000 |
| Friday, January 1, 2016 | 750483000 | 716731000 |
| Sunday, January 1, 2017 | 818595000 | 897900000 |
| Monday, January 1, 2018 | 871261000 | 1012500000 |
| Tuesday, January 1, 2019 | 898745000 | 911700000 |
| Wednesday, January 1, 2020 | 841227000 | 1613400000 |
| Friday, January 1, 2021 | 933356000 | 1988500000 |
| Saturday, January 1, 2022 | 954609000 | 2325600000 |
| Sunday, January 1, 2023 | 1067178000 | 2882200000 |
| Monday, January 1, 2024 | 1153549000 | 0 |
Unveiling the hidden dimensions of data
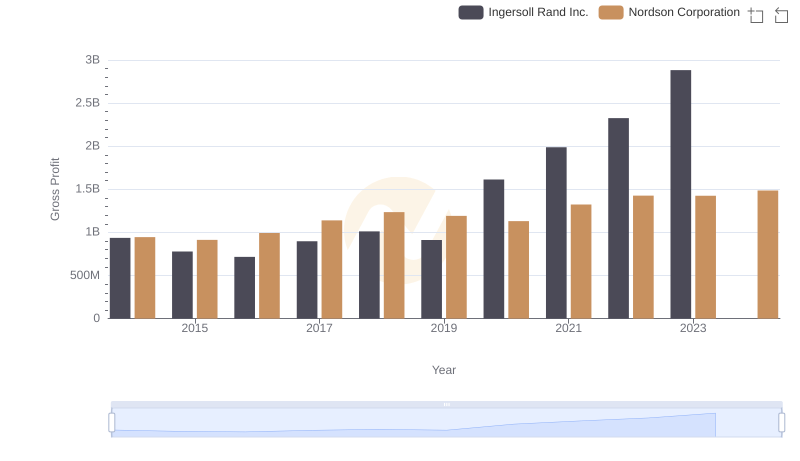
In the competitive landscape of industrial manufacturing, two titans stand out: Ingersoll Rand Inc. and Curtiss-Wright Corporation. Over the past decade, these companies have showcased their prowess in generating gross profit, a key indicator of financial health and operational efficiency.
From 2014 to 2023, Ingersoll Rand Inc. consistently outperformed Curtiss-Wright Corporation, with a notable surge in 2023, where its gross profit was approximately 170% higher than Curtiss-Wright's. This trend highlights Ingersoll Rand's strategic growth and market adaptability.
Curtiss-Wright, while trailing, demonstrated steady growth, peaking in 2023 with a gross profit increase of about 42% from 2014. This resilience underscores its commitment to innovation and efficiency.
As these industrial giants continue to evolve, their financial trajectories offer valuable insights into the broader economic landscape.
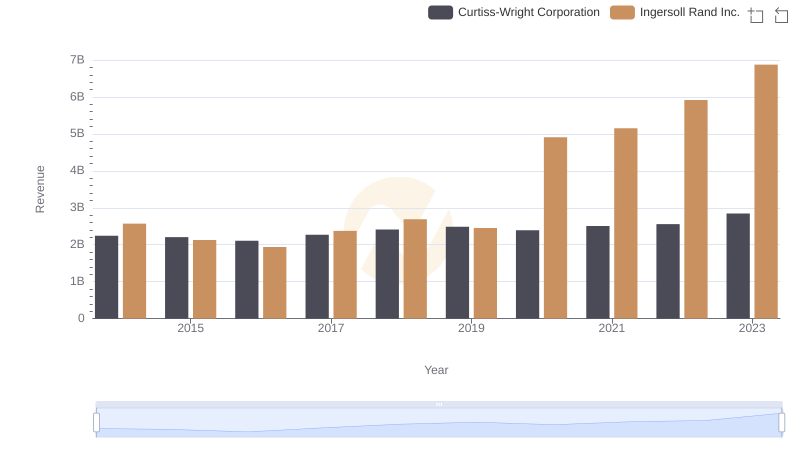
Ingersoll Rand Inc. or Curtiss-Wright Corporation: Who Leads in Yearly Revenue?
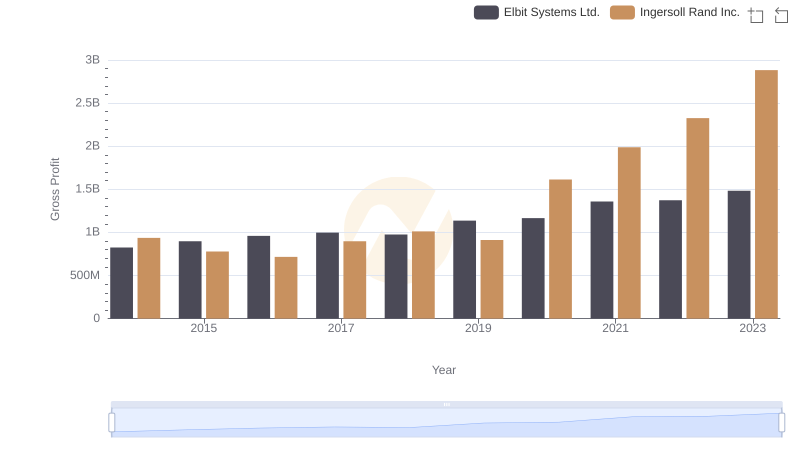
Gross Profit Analysis: Comparing Ingersoll Rand Inc. and Elbit Systems Ltd.
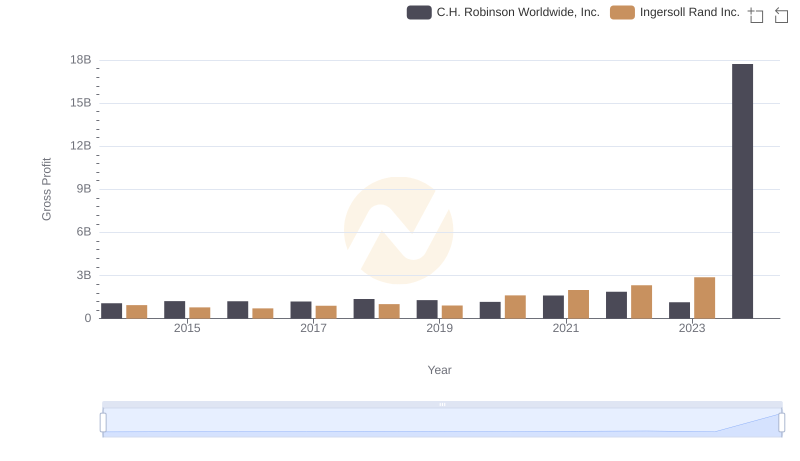
Ingersoll Rand Inc. and C.H. Robinson Worldwide, Inc.: A Detailed Gross Profit Analysis
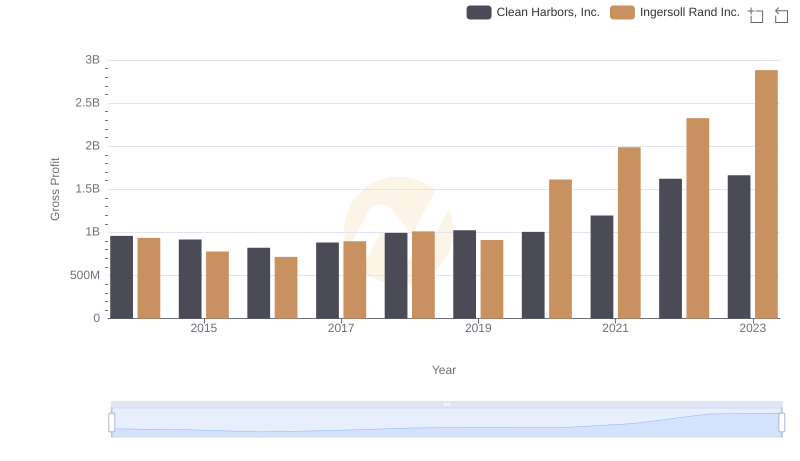
Who Generates Higher Gross Profit? Ingersoll Rand Inc. or Clean Harbors, Inc.
Ingersoll Rand Inc. vs Nordson Corporation: A Gross Profit Performance Breakdown