| __timestamp | Elbit Systems Ltd. | Ingersoll Rand Inc. |
|---|---|---|
| Wednesday, January 1, 2014 | 825097000 | 936781000 |
| Thursday, January 1, 2015 | 897053000 | 779100000 |
| Friday, January 1, 2016 | 959583000 | 716731000 |
| Sunday, January 1, 2017 | 997920000 | 897900000 |
| Monday, January 1, 2018 | 976179000 | 1012500000 |
| Tuesday, January 1, 2019 | 1136467000 | 911700000 |
| Wednesday, January 1, 2020 | 1165107000 | 1613400000 |
| Friday, January 1, 2021 | 1358048000 | 1988500000 |
| Saturday, January 1, 2022 | 1373283000 | 2325600000 |
| Sunday, January 1, 2023 | 1482954000 | 2882200000 |
| Monday, January 1, 2024 | 0 |
In pursuit of knowledge
In the ever-evolving landscape of global industry, understanding financial performance is crucial. This analysis delves into the gross profit trends of two industrial giants: Ingersoll Rand Inc. and Elbit Systems Ltd., from 2014 to 2023.
Over the past decade, Ingersoll Rand Inc. has demonstrated a remarkable growth trajectory, with its gross profit increasing by over 200%. In 2023, it reached a peak, nearly tripling its 2014 figures. Meanwhile, Elbit Systems Ltd. has shown a steady upward trend, with a 79% increase in gross profit over the same period.
While both companies have shown growth, Ingersoll Rand's aggressive expansion strategy has outpaced Elbit Systems, especially post-2020. This divergence highlights the impact of strategic decisions in the industrial sector. As we look to the future, these trends offer valuable insights for investors and industry analysts alike.
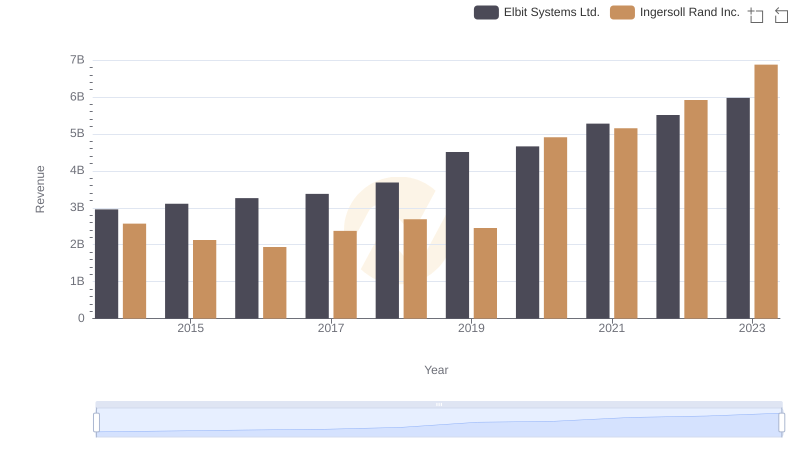
Comparing Revenue Performance: Ingersoll Rand Inc. or Elbit Systems Ltd.?
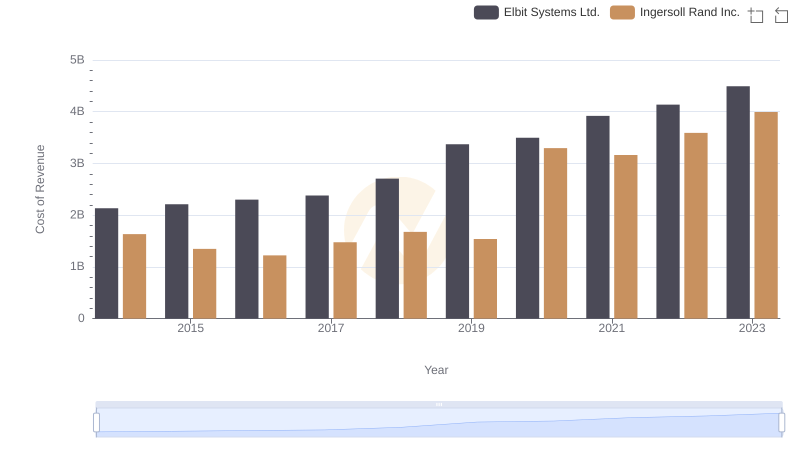
Cost of Revenue Trends: Ingersoll Rand Inc. vs Elbit Systems Ltd.
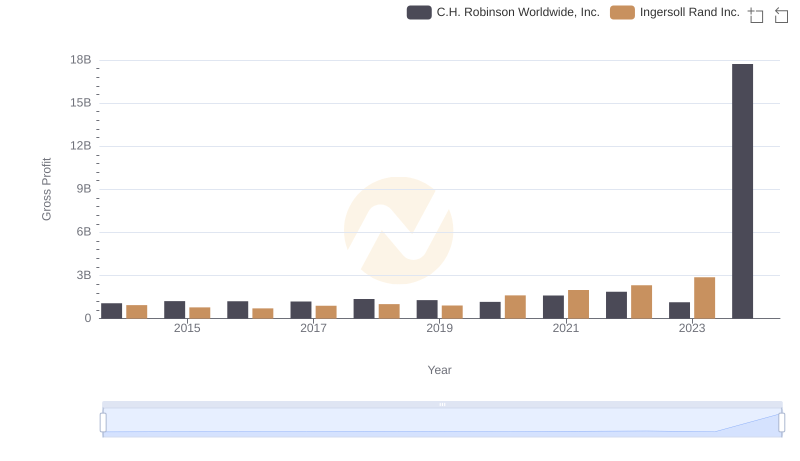
Ingersoll Rand Inc. and C.H. Robinson Worldwide, Inc.: A Detailed Gross Profit Analysis
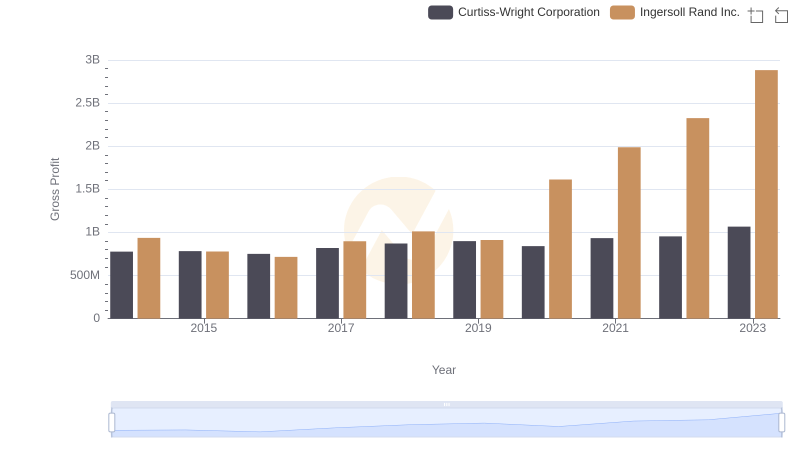
Who Generates Higher Gross Profit? Ingersoll Rand Inc. or Curtiss-Wright Corporation
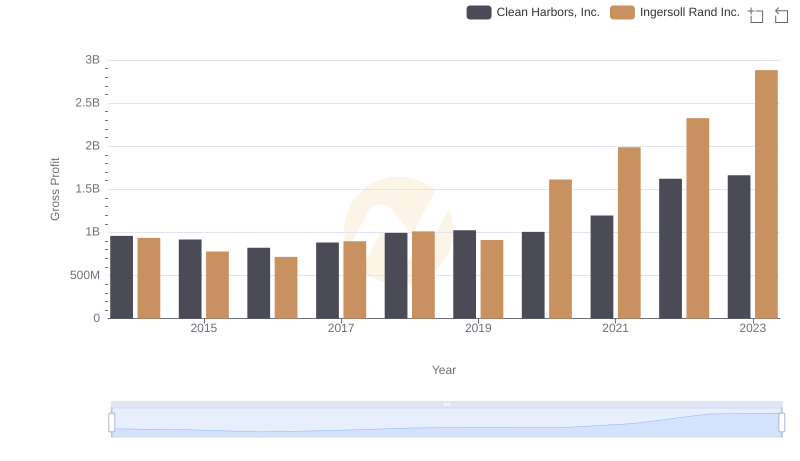
Who Generates Higher Gross Profit? Ingersoll Rand Inc. or Clean Harbors, Inc.
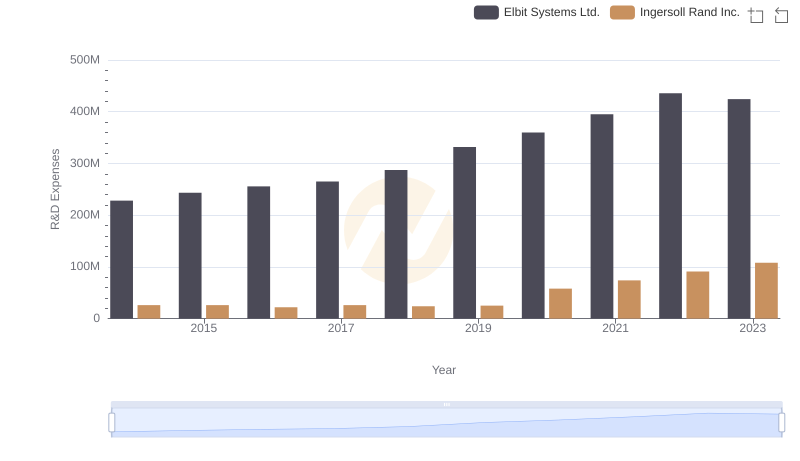
Ingersoll Rand Inc. vs Elbit Systems Ltd.: Strategic Focus on R&D Spending
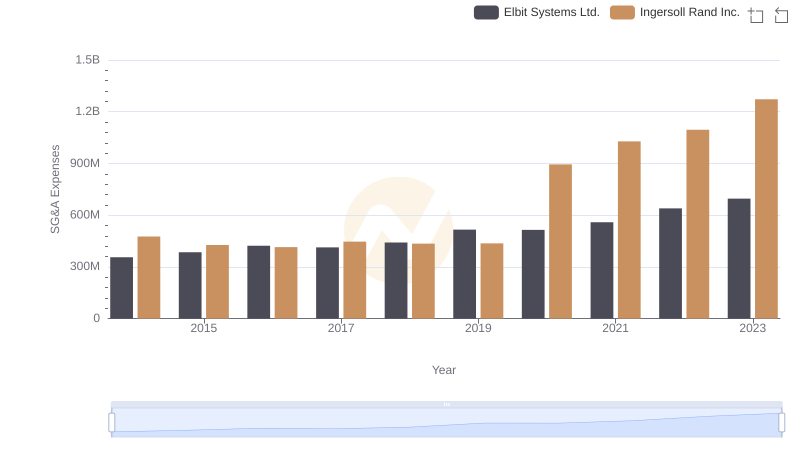
SG&A Efficiency Analysis: Comparing Ingersoll Rand Inc. and Elbit Systems Ltd.