| __timestamp | Equifax Inc. | ITT Inc. |
|---|---|---|
| Wednesday, January 1, 2014 | 1591700000 | 866400000 |
| Thursday, January 1, 2015 | 1776200000 | 809100000 |
| Friday, January 1, 2016 | 2031500000 | 758200000 |
| Sunday, January 1, 2017 | 2151500000 | 817200000 |
| Monday, January 1, 2018 | 1971700000 | 887200000 |
| Tuesday, January 1, 2019 | 1985900000 | 910100000 |
| Wednesday, January 1, 2020 | 2390100000 | 782200000 |
| Friday, January 1, 2021 | 2943000000 | 899500000 |
| Saturday, January 1, 2022 | 2945000000 | 922300000 |
| Sunday, January 1, 2023 | 2930100000 | 1107300000 |
| Monday, January 1, 2024 | 5681100000 | 1247300000 |
Unlocking the unknown
In the ever-evolving landscape of the financial sector, understanding the gross profit trends of major companies is crucial. Over the past decade, Equifax Inc. and ITT Inc. have shown distinct trajectories in their financial performance. From 2014 to 2023, Equifax Inc. has seen a remarkable 84% increase in gross profit, peaking in 2022 with a 2.95 billion USD mark. In contrast, ITT Inc. experienced a more modest growth of 28%, reaching its highest gross profit in 2023 at 1.11 billion USD.
This comparison highlights Equifax's robust growth strategy, especially post-2020, where it surged by 23% in just three years. Meanwhile, ITT Inc.'s steady climb reflects a consistent, albeit slower, growth pattern. These insights provide a window into the strategic decisions and market conditions influencing these industry giants.
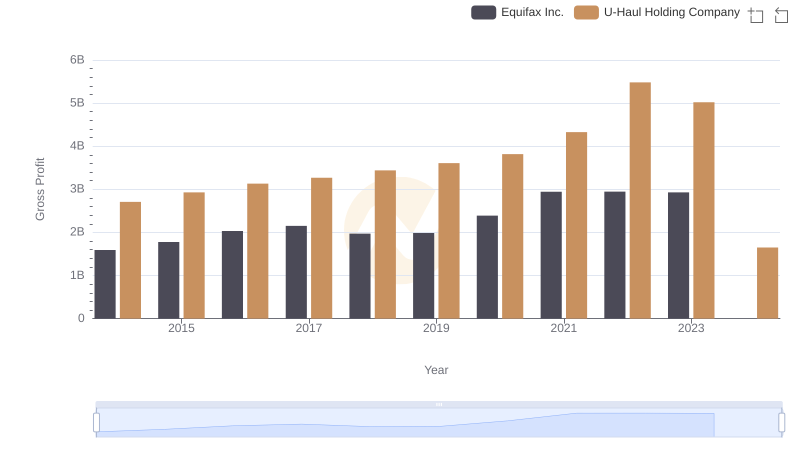
Equifax Inc. and U-Haul Holding Company: A Detailed Gross Profit Analysis
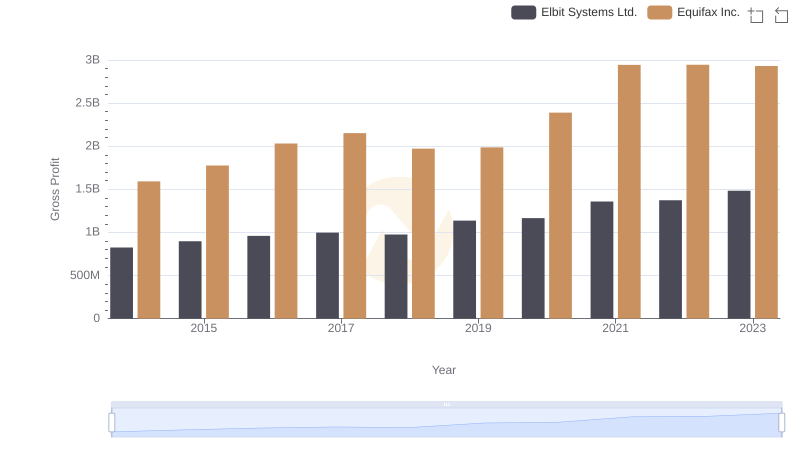
Gross Profit Analysis: Comparing Equifax Inc. and Elbit Systems Ltd.
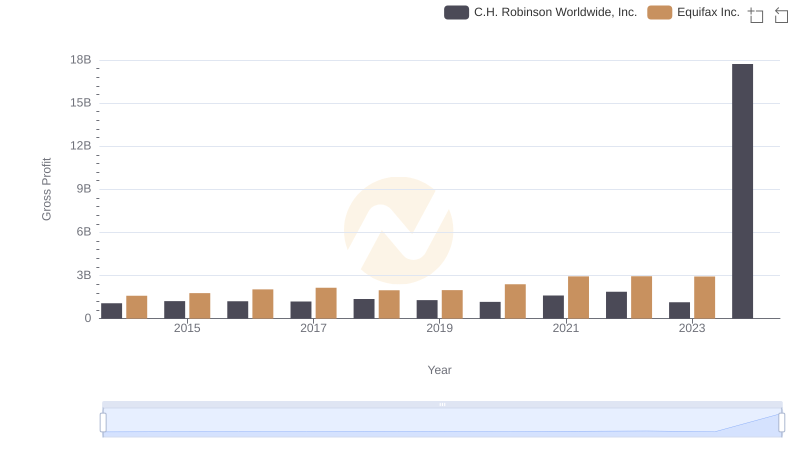
Equifax Inc. and C.H. Robinson Worldwide, Inc.: A Detailed Gross Profit Analysis
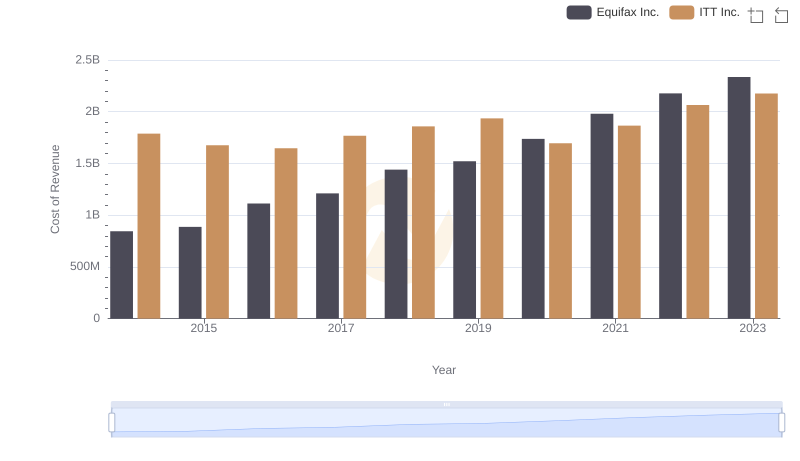
Analyzing Cost of Revenue: Equifax Inc. and ITT Inc.
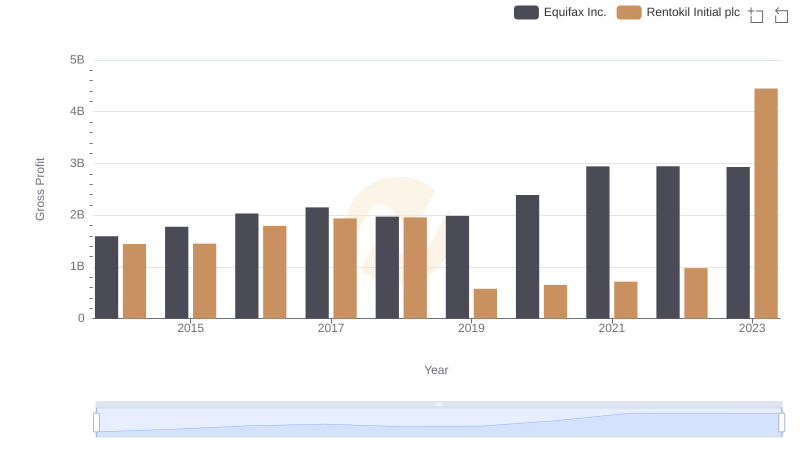
Equifax Inc. vs Rentokil Initial plc: A Gross Profit Performance Breakdown
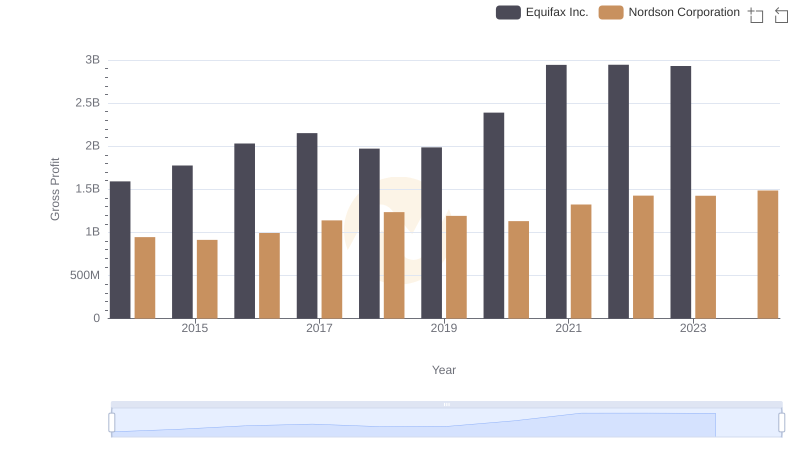
Gross Profit Comparison: Equifax Inc. and Nordson Corporation Trends
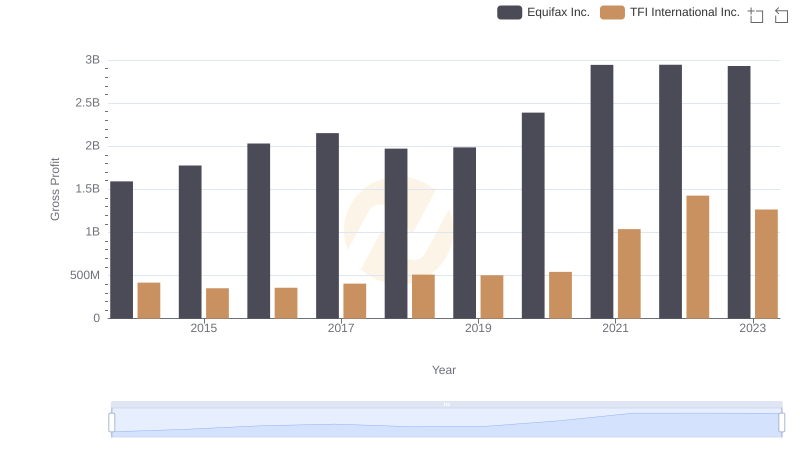
Equifax Inc. and TFI International Inc.: A Detailed Gross Profit Analysis
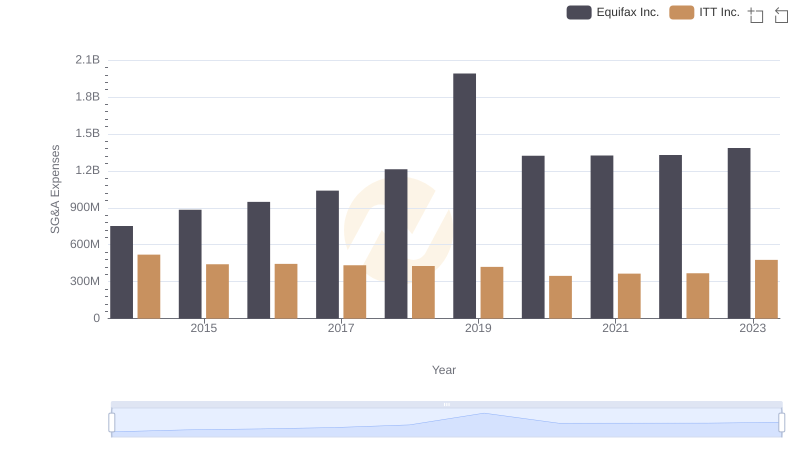
Comparing SG&A Expenses: Equifax Inc. vs ITT Inc. Trends and Insights