| __timestamp | Equifax Inc. | TFI International Inc. |
|---|---|---|
| Wednesday, January 1, 2014 | 1591700000 | 417323364 |
| Thursday, January 1, 2015 | 1776200000 | 352552803 |
| Friday, January 1, 2016 | 2031500000 | 358230042 |
| Sunday, January 1, 2017 | 2151500000 | 405214314 |
| Monday, January 1, 2018 | 1971700000 | 510006388 |
| Tuesday, January 1, 2019 | 1985900000 | 502631921 |
| Wednesday, January 1, 2020 | 2390100000 | 541885000 |
| Friday, January 1, 2021 | 2943000000 | 1037863000 |
| Saturday, January 1, 2022 | 2945000000 | 1426851000 |
| Sunday, January 1, 2023 | 2930100000 | 1265392000 |
| Monday, January 1, 2024 | 5681100000 |
Data in motion
In the ever-evolving landscape of financial performance, Equifax Inc. and TFI International Inc. have demonstrated remarkable growth in gross profit over the past decade. From 2014 to 2023, Equifax Inc. saw its gross profit soar by approximately 84%, peaking in 2022 with a staggering $2.945 billion. This growth reflects the company's strategic initiatives and resilience in the face of economic challenges.
Meanwhile, TFI International Inc. experienced an even more impressive trajectory, with its gross profit increasing by over 200% during the same period. The company reached its zenith in 2022, achieving a gross profit of $1.427 billion, showcasing its robust expansion and operational efficiency.
This analysis highlights the dynamic nature of the financial sector, where strategic foresight and adaptability are key to sustained growth. As we look to the future, these companies continue to set benchmarks in profitability and industry leadership.
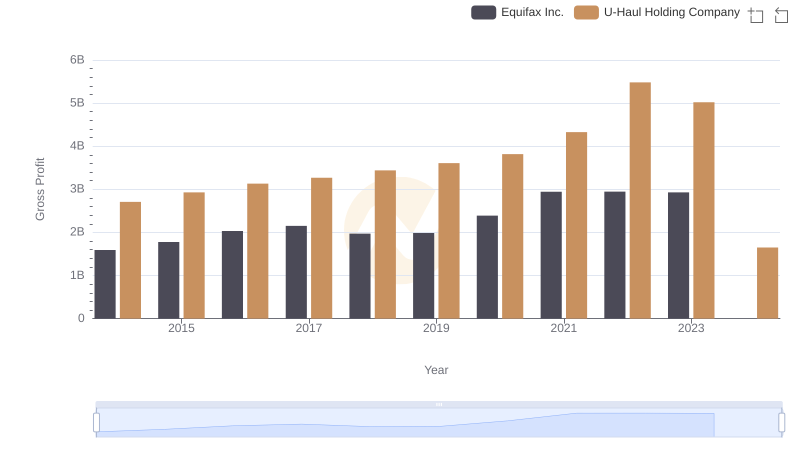
Equifax Inc. and U-Haul Holding Company: A Detailed Gross Profit Analysis
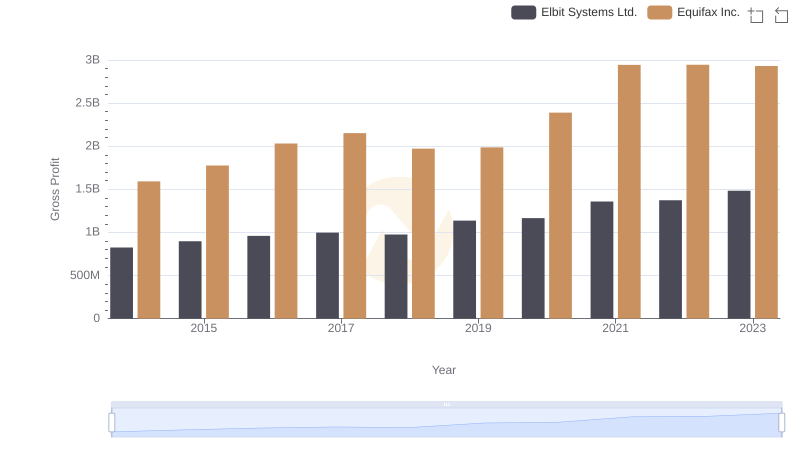
Gross Profit Analysis: Comparing Equifax Inc. and Elbit Systems Ltd.
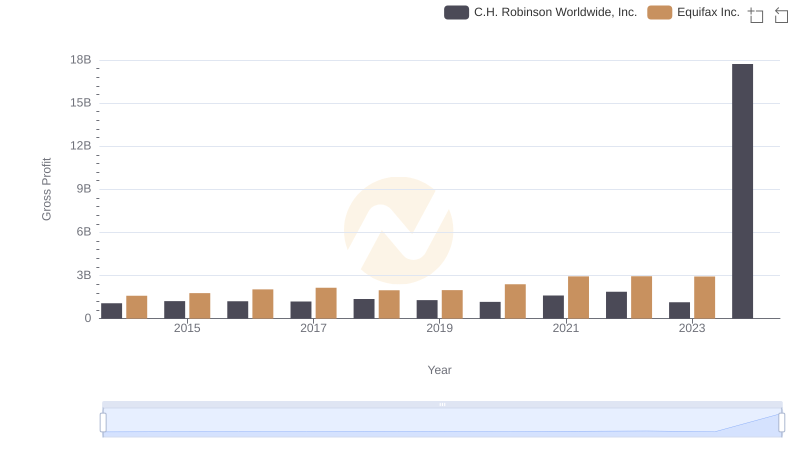
Equifax Inc. and C.H. Robinson Worldwide, Inc.: A Detailed Gross Profit Analysis
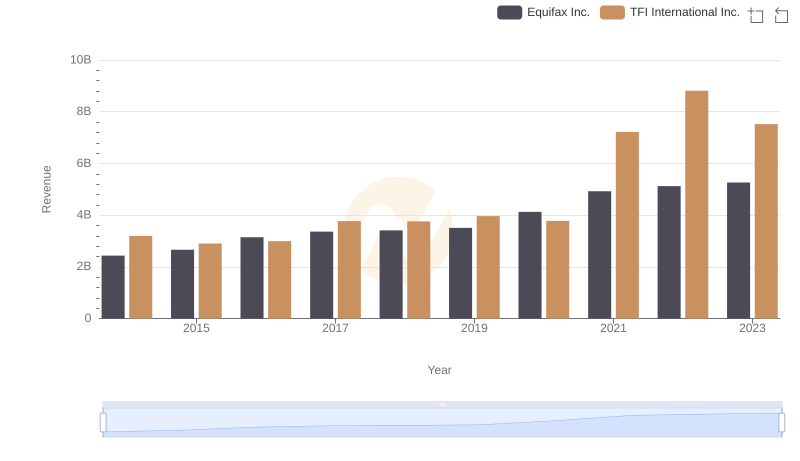
Equifax Inc. or TFI International Inc.: Who Leads in Yearly Revenue?
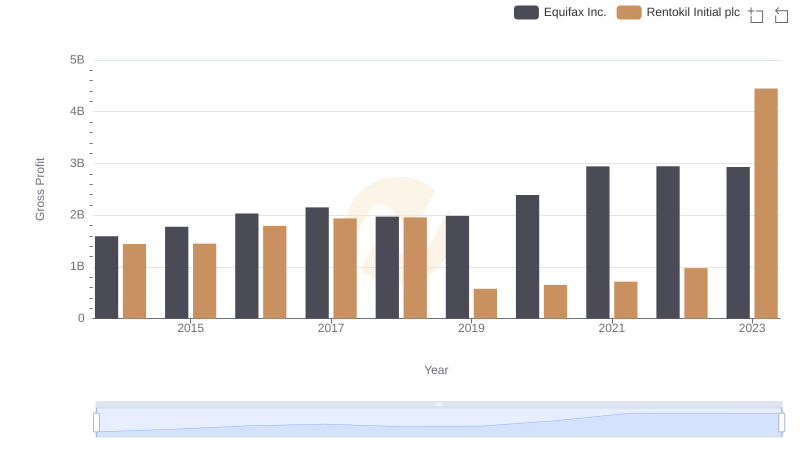
Equifax Inc. vs Rentokil Initial plc: A Gross Profit Performance Breakdown

Gross Profit Comparison: Equifax Inc. and ITT Inc. Trends
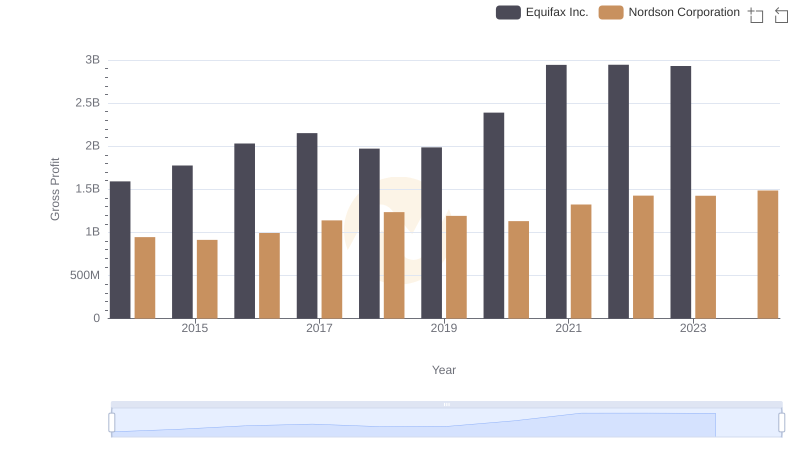
Gross Profit Comparison: Equifax Inc. and Nordson Corporation Trends
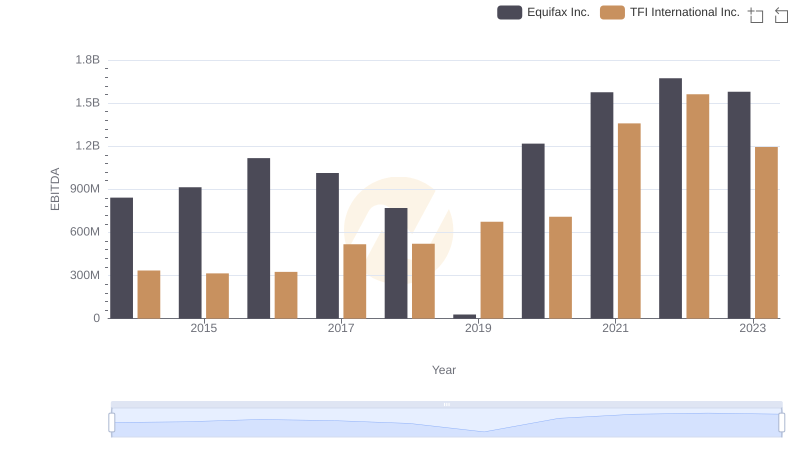
A Side-by-Side Analysis of EBITDA: Equifax Inc. and TFI International Inc.