| __timestamp | Equifax Inc. | Nordson Corporation |
|---|---|---|
| Wednesday, January 1, 2014 | 1591700000 | 945098000 |
| Thursday, January 1, 2015 | 1776200000 | 913964000 |
| Friday, January 1, 2016 | 2031500000 | 993499000 |
| Sunday, January 1, 2017 | 2151500000 | 1139001000 |
| Monday, January 1, 2018 | 1971700000 | 1235965000 |
| Tuesday, January 1, 2019 | 1985900000 | 1192103000 |
| Wednesday, January 1, 2020 | 2390100000 | 1130468000 |
| Friday, January 1, 2021 | 2943000000 | 1324080000 |
| Saturday, January 1, 2022 | 2945000000 | 1426536000 |
| Sunday, January 1, 2023 | 2930100000 | 1425405000 |
| Monday, January 1, 2024 | 5681100000 | 1486129000 |
Unleashing insights
In the ever-evolving landscape of corporate finance, understanding the trends in gross profit can offer valuable insights into a company's operational efficiency and market position. From 2014 to 2023, Equifax Inc. and Nordson Corporation have showcased distinct trajectories in their financial performance.
Equifax Inc. experienced a robust growth in gross profit, peaking in 2022 with a remarkable 85% increase from 2014. However, 2023 saw a slight dip, indicating potential challenges or market adjustments. In contrast, Nordson Corporation demonstrated steady growth, with a 51% rise over the same period, culminating in its highest gross profit in 2024.
These trends highlight the dynamic nature of the financial sector, where companies must continuously adapt to maintain profitability. Missing data for Equifax in 2024 suggests a need for further analysis to understand future prospects.
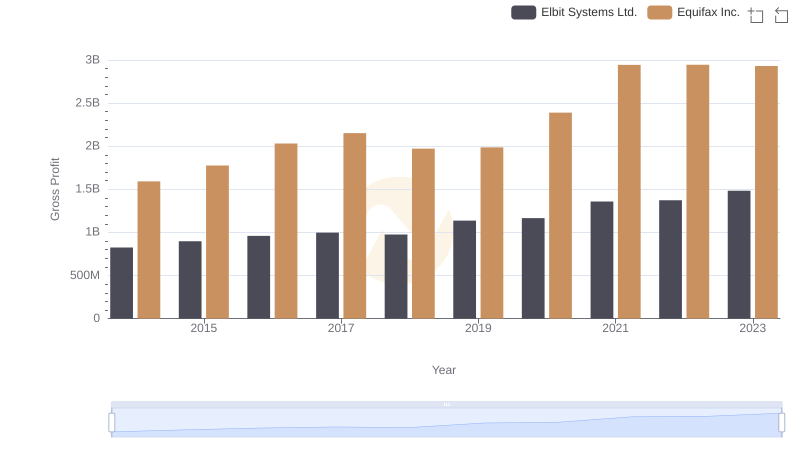
Gross Profit Analysis: Comparing Equifax Inc. and Elbit Systems Ltd.
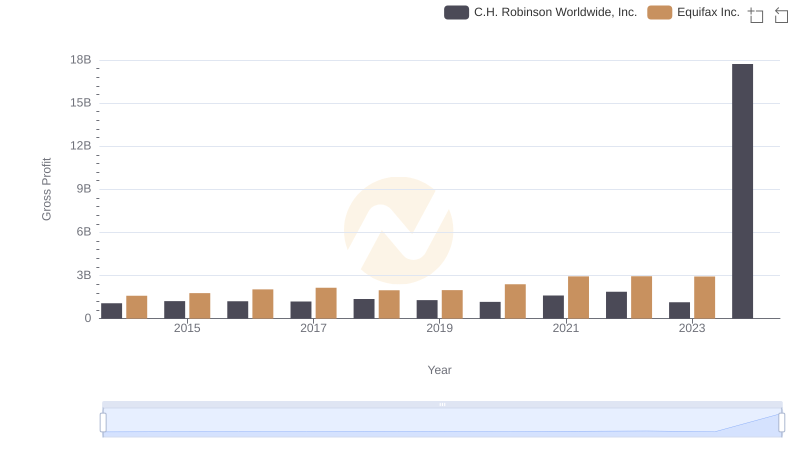
Equifax Inc. and C.H. Robinson Worldwide, Inc.: A Detailed Gross Profit Analysis
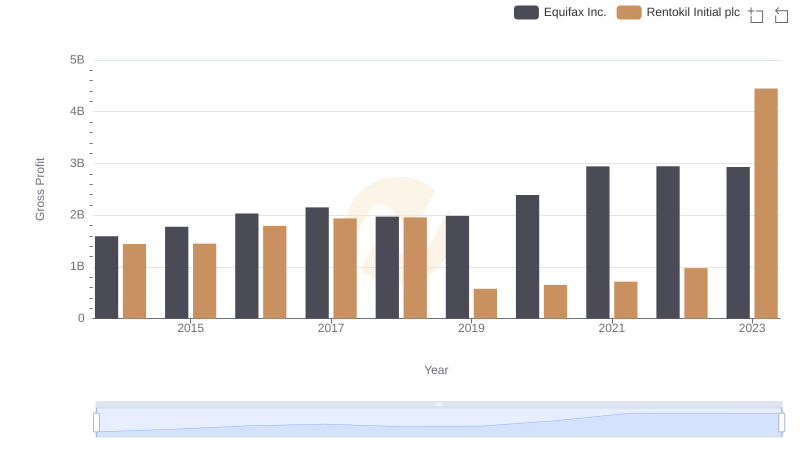
Equifax Inc. vs Rentokil Initial plc: A Gross Profit Performance Breakdown

Gross Profit Comparison: Equifax Inc. and ITT Inc. Trends
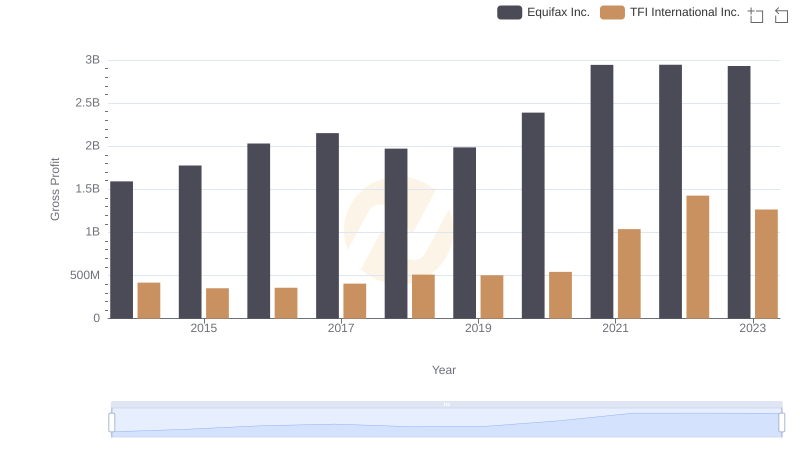
Equifax Inc. and TFI International Inc.: A Detailed Gross Profit Analysis
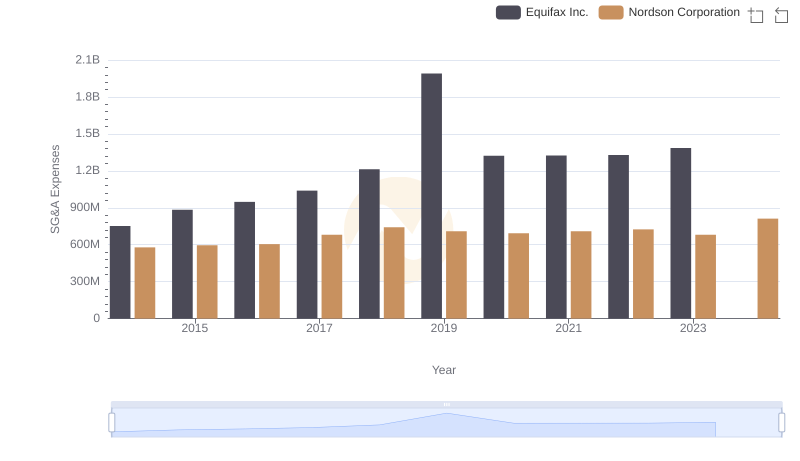
Comparing SG&A Expenses: Equifax Inc. vs Nordson Corporation Trends and Insights