| __timestamp | C.H. Robinson Worldwide, Inc. | Equifax Inc. |
|---|---|---|
| Wednesday, January 1, 2014 | 1068631000 | 1591700000 |
| Thursday, January 1, 2015 | 1217070000 | 1776200000 |
| Friday, January 1, 2016 | 1212592000 | 2031500000 |
| Sunday, January 1, 2017 | 1188523000 | 2151500000 |
| Monday, January 1, 2018 | 1361693000 | 1971700000 |
| Tuesday, January 1, 2019 | 1287782000 | 1985900000 |
| Wednesday, January 1, 2020 | 1169390000 | 2390100000 |
| Friday, January 1, 2021 | 1608479000 | 2943000000 |
| Saturday, January 1, 2022 | 1870197000 | 2945000000 |
| Sunday, January 1, 2023 | 1138873000 | 2930100000 |
| Monday, January 1, 2024 | 1308765000 | 5681100000 |
In pursuit of knowledge
In the ever-evolving landscape of corporate finance, understanding the gross profit trends of industry giants like Equifax Inc. and C.H. Robinson Worldwide, Inc. offers invaluable insights. Over the past decade, Equifax has demonstrated a steady upward trajectory in gross profit, peaking in 2022 with a remarkable 85% increase from 2014. Meanwhile, C.H. Robinson Worldwide, Inc. experienced a more volatile journey, with a significant spike in 2024, marking a staggering 1,560% rise from its 2014 figures.
These trends underscore the dynamic nature of these companies' financial strategies and market positions, offering a fascinating glimpse into their operational efficiencies and market adaptability.
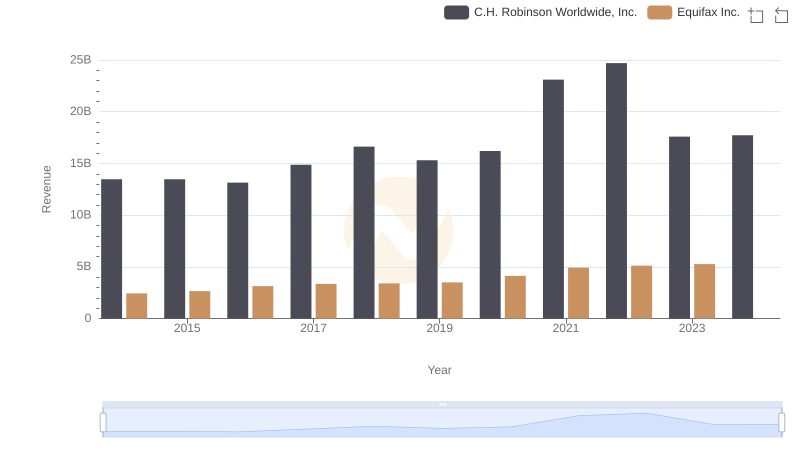
Annual Revenue Comparison: Equifax Inc. vs C.H. Robinson Worldwide, Inc.

Key Insights on Gross Profit: Equifax Inc. vs Comfort Systems USA, Inc.
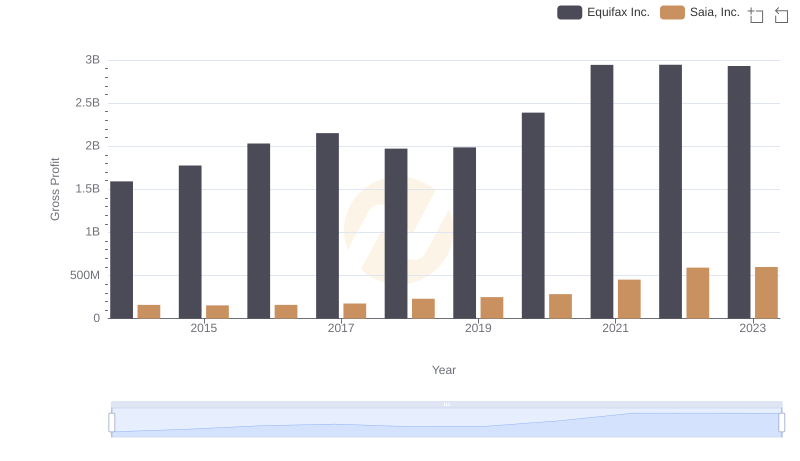
Who Generates Higher Gross Profit? Equifax Inc. or Saia, Inc.
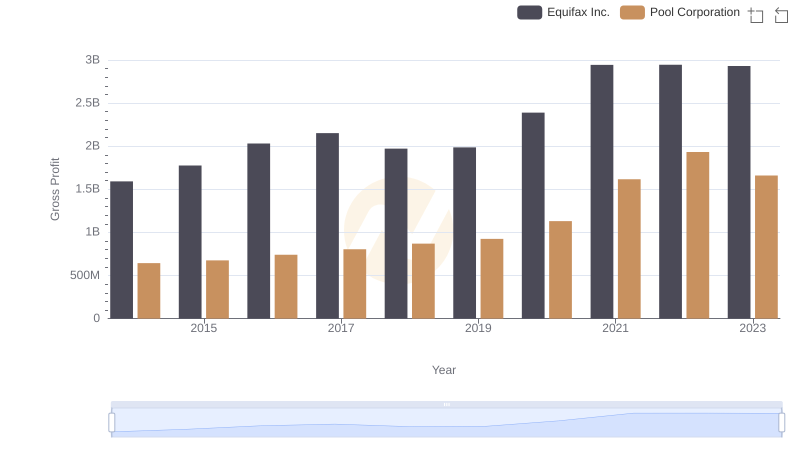
Gross Profit Comparison: Equifax Inc. and Pool Corporation Trends
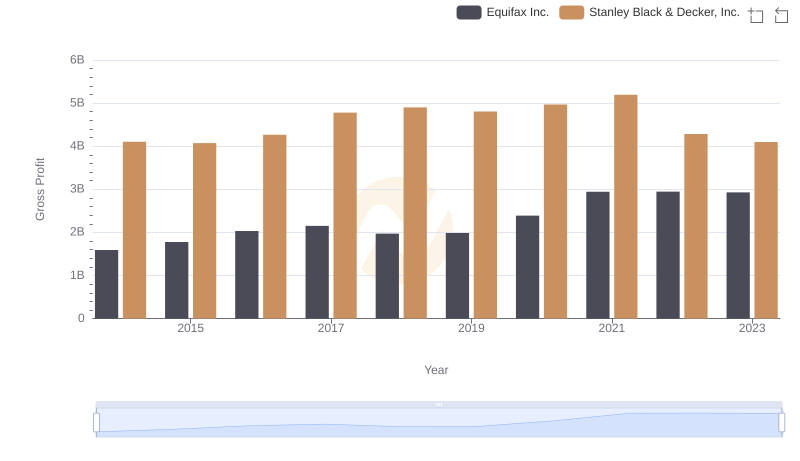
Key Insights on Gross Profit: Equifax Inc. vs Stanley Black & Decker, Inc.
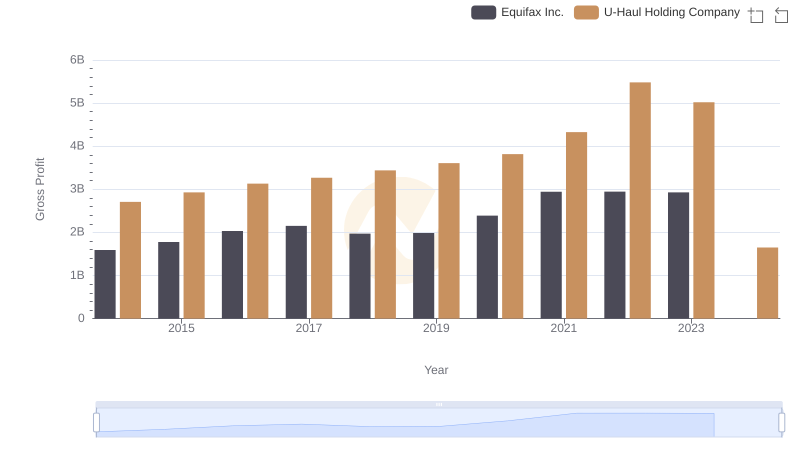
Equifax Inc. and U-Haul Holding Company: A Detailed Gross Profit Analysis
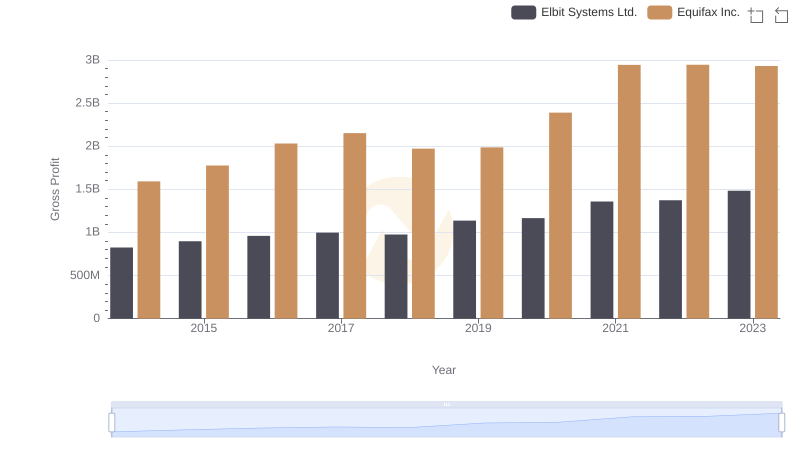
Gross Profit Analysis: Comparing Equifax Inc. and Elbit Systems Ltd.
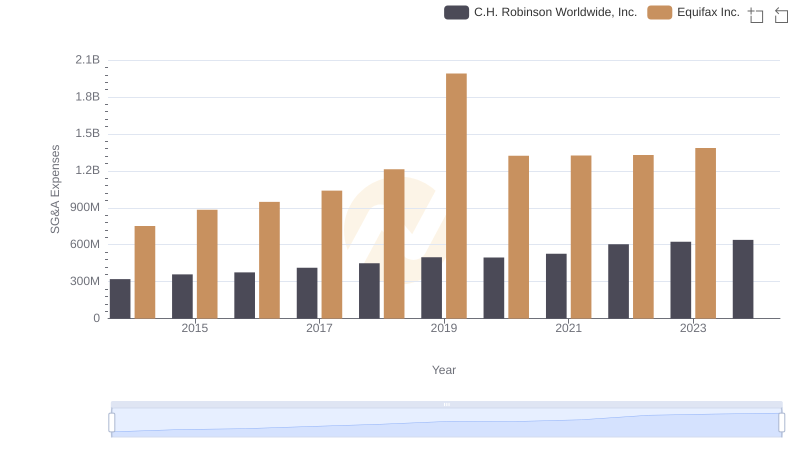
Breaking Down SG&A Expenses: Equifax Inc. vs C.H. Robinson Worldwide, Inc.