| __timestamp | Equifax Inc. | ITT Inc. |
|---|---|---|
| Wednesday, January 1, 2014 | 844700000 | 1788200000 |
| Thursday, January 1, 2015 | 887400000 | 1676500000 |
| Friday, January 1, 2016 | 1113400000 | 1647200000 |
| Sunday, January 1, 2017 | 1210700000 | 1768100000 |
| Monday, January 1, 2018 | 1440400000 | 1857900000 |
| Tuesday, January 1, 2019 | 1521700000 | 1936300000 |
| Wednesday, January 1, 2020 | 1737400000 | 1695600000 |
| Friday, January 1, 2021 | 1980900000 | 1865500000 |
| Saturday, January 1, 2022 | 2177200000 | 2065400000 |
| Sunday, January 1, 2023 | 2335100000 | 2175700000 |
| Monday, January 1, 2024 | 0 | 2383400000 |
In pursuit of knowledge
In the ever-evolving landscape of corporate finance, understanding the cost of revenue is crucial for evaluating a company's efficiency and profitability. This analysis delves into the cost of revenue trends for Equifax Inc. and ITT Inc. from 2014 to 2023. Over this period, Equifax Inc. has seen a remarkable increase of approximately 176% in its cost of revenue, reflecting its expanding operations and market reach. In contrast, ITT Inc. experienced a more modest growth of around 22%, indicating a stable yet consistent operational scale.
The data reveals that while both companies have increased their cost of revenue, Equifax's growth trajectory is steeper, suggesting aggressive expansion strategies. This insight is pivotal for investors and stakeholders aiming to understand the financial dynamics and strategic directions of these industry giants.
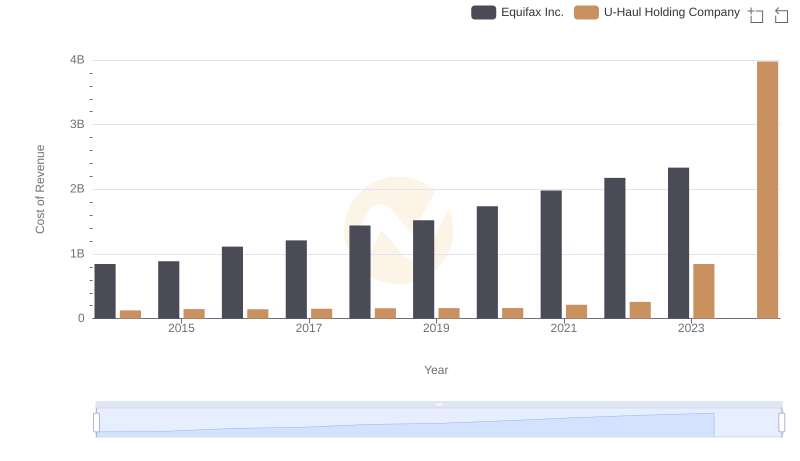
Cost of Revenue Comparison: Equifax Inc. vs U-Haul Holding Company
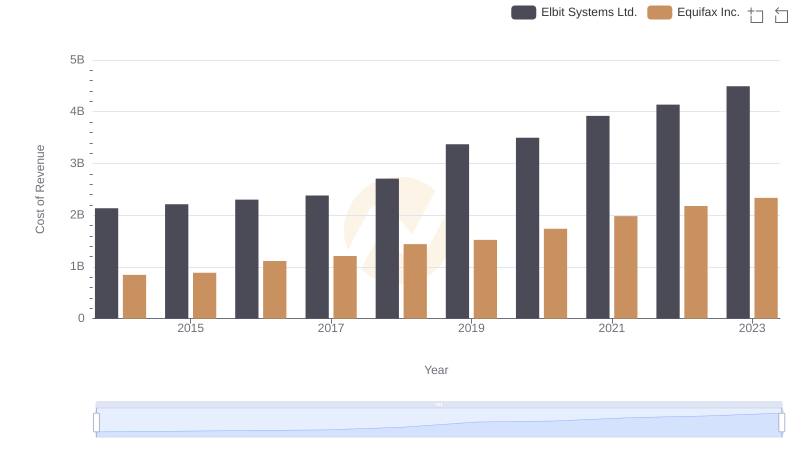
Cost of Revenue Comparison: Equifax Inc. vs Elbit Systems Ltd.
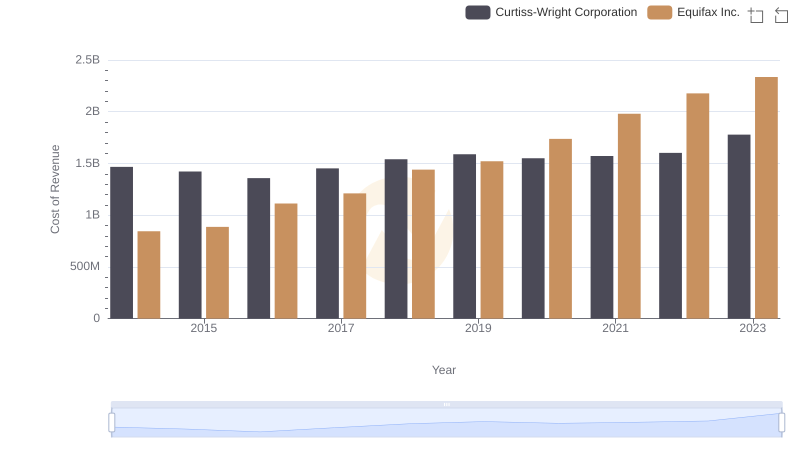
Cost of Revenue Trends: Equifax Inc. vs Curtiss-Wright Corporation
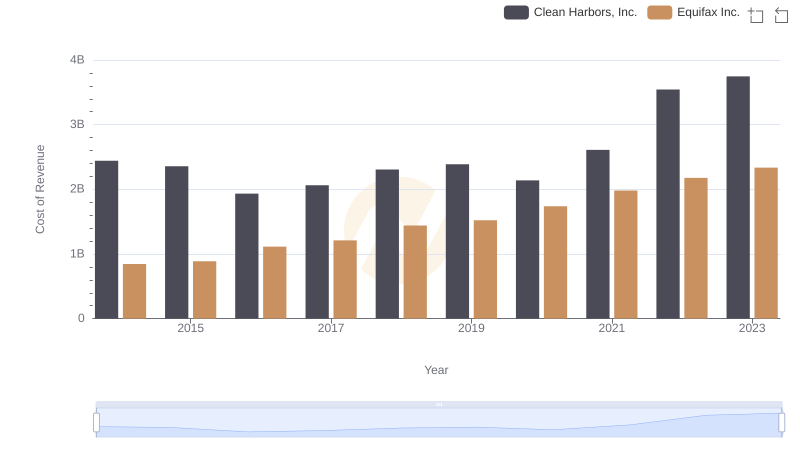
Comparing Cost of Revenue Efficiency: Equifax Inc. vs Clean Harbors, Inc.

Gross Profit Comparison: Equifax Inc. and ITT Inc. Trends
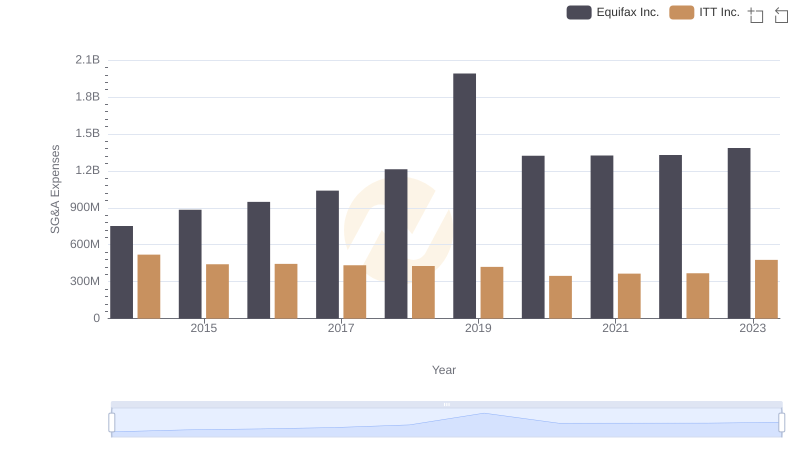
Comparing SG&A Expenses: Equifax Inc. vs ITT Inc. Trends and Insights