| __timestamp | Equifax Inc. | ITT Inc. |
|---|---|---|
| Wednesday, January 1, 2014 | 751700000 | 519500000 |
| Thursday, January 1, 2015 | 884300000 | 441500000 |
| Friday, January 1, 2016 | 948200000 | 444100000 |
| Sunday, January 1, 2017 | 1039100000 | 433700000 |
| Monday, January 1, 2018 | 1213300000 | 427300000 |
| Tuesday, January 1, 2019 | 1990200000 | 420000000 |
| Wednesday, January 1, 2020 | 1322500000 | 347200000 |
| Friday, January 1, 2021 | 1324600000 | 365100000 |
| Saturday, January 1, 2022 | 1328900000 | 368500000 |
| Sunday, January 1, 2023 | 1385700000 | 476600000 |
| Monday, January 1, 2024 | 1450500000 | 502300000 |
Unlocking the unknown
In the ever-evolving landscape of corporate finance, understanding the trends in Selling, General, and Administrative (SG&A) expenses is crucial. From 2014 to 2023, Equifax Inc. and ITT Inc. have shown contrasting trajectories in their SG&A expenses. Equifax Inc. has seen a remarkable 84% increase, peaking in 2019, while ITT Inc. experienced a more modest 8% decline over the same period.
Equifax's expenses surged notably in 2019, reaching their highest point, which could be attributed to strategic investments or restructuring efforts. In contrast, ITT Inc. maintained a relatively stable expense pattern, with a slight dip in 2020, possibly due to cost-cutting measures.
These insights highlight the diverse strategies companies employ to manage operational costs, reflecting their unique market positions and growth ambitions. As businesses navigate economic uncertainties, monitoring such financial metrics becomes indispensable for stakeholders.
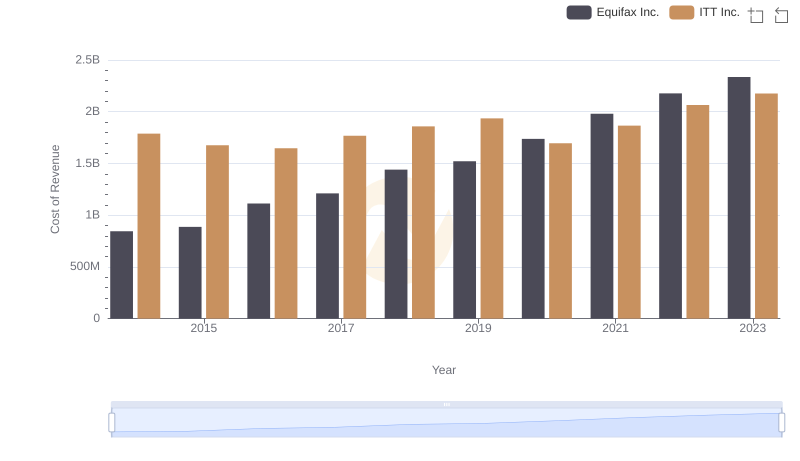
Analyzing Cost of Revenue: Equifax Inc. and ITT Inc.
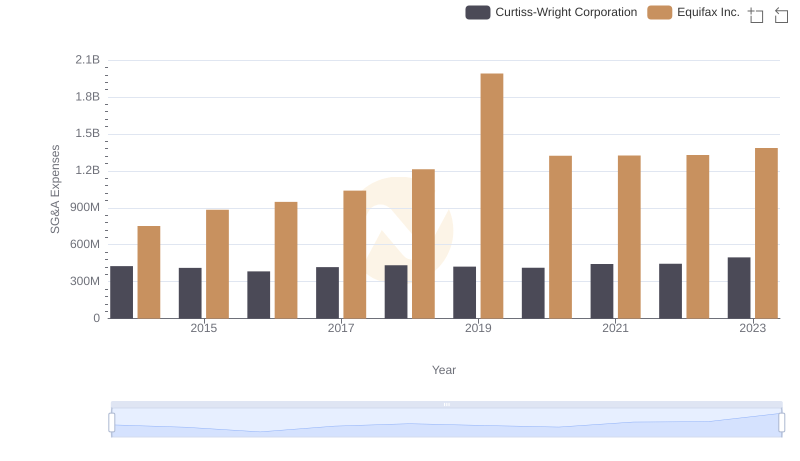
Equifax Inc. or Curtiss-Wright Corporation: Who Manages SG&A Costs Better?
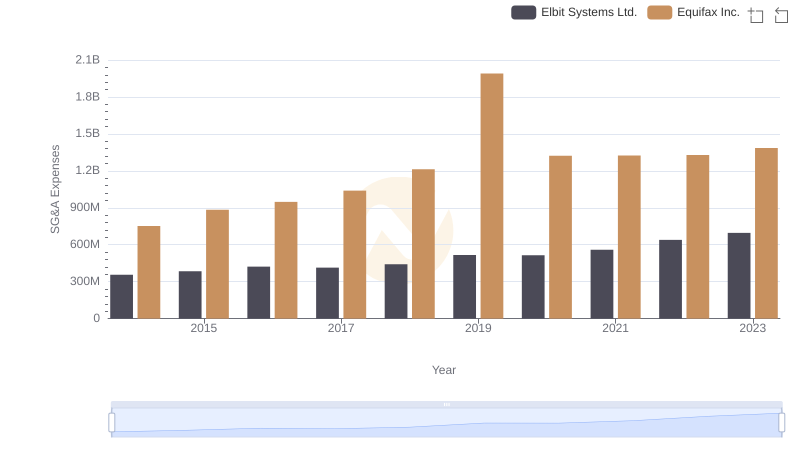
Operational Costs Compared: SG&A Analysis of Equifax Inc. and Elbit Systems Ltd.
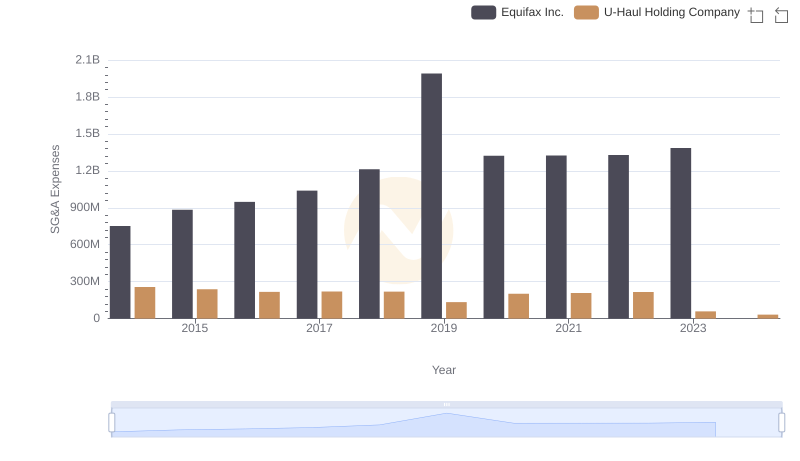
Selling, General, and Administrative Costs: Equifax Inc. vs U-Haul Holding Company
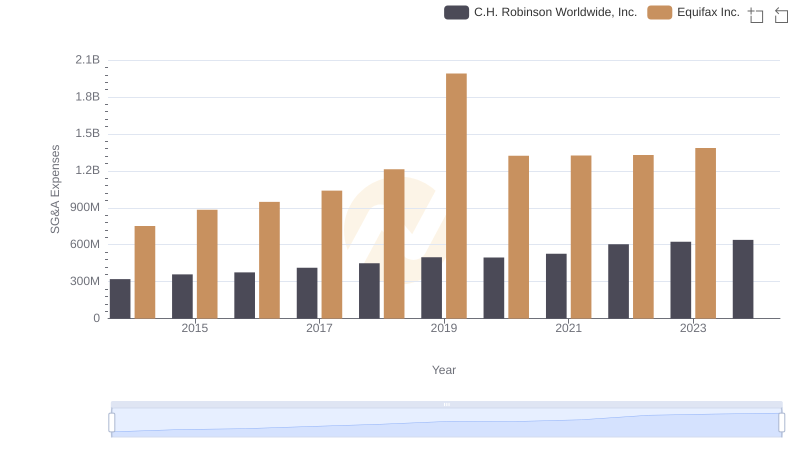
Breaking Down SG&A Expenses: Equifax Inc. vs C.H. Robinson Worldwide, Inc.

Gross Profit Comparison: Equifax Inc. and ITT Inc. Trends
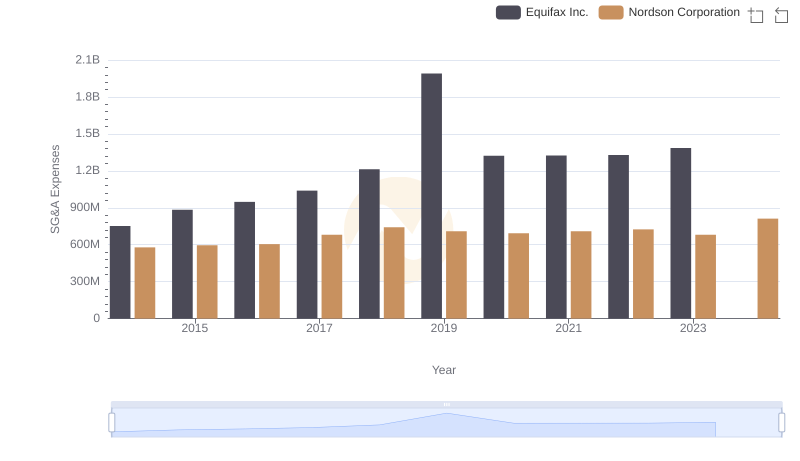
Comparing SG&A Expenses: Equifax Inc. vs Nordson Corporation Trends and Insights