| __timestamp | Automatic Data Processing, Inc. | Comfort Systems USA, Inc. |
|---|---|---|
| Wednesday, January 1, 2014 | 4611400000 | 249771000 |
| Thursday, January 1, 2015 | 4133200000 | 318129000 |
| Friday, January 1, 2016 | 4450200000 | 344009000 |
| Sunday, January 1, 2017 | 4712600000 | 366281000 |
| Monday, January 1, 2018 | 5016700000 | 446279000 |
| Tuesday, January 1, 2019 | 5526700000 | 501943000 |
| Wednesday, January 1, 2020 | 6144700000 | 546983000 |
| Friday, January 1, 2021 | 6365100000 | 563207000 |
| Saturday, January 1, 2022 | 7036400000 | 741608000 |
| Sunday, January 1, 2023 | 8058800000 | 990509000 |
| Monday, January 1, 2024 | 8725900000 |
In pursuit of knowledge
In the ever-evolving landscape of the U.S. stock market, Automatic Data Processing, Inc. (ADP) and Comfort Systems USA, Inc. (FIX) have showcased intriguing trends in their gross profits over the past decade. From 2014 to 2023, ADP's gross profit surged by approximately 89%, reflecting its robust growth and market adaptability. In contrast, Comfort Systems USA, Inc. experienced a remarkable 297% increase, highlighting its dynamic expansion in the HVAC industry.
While ADP consistently maintained higher gross profits, Comfort Systems USA, Inc. demonstrated impressive growth rates, especially in recent years. Notably, 2023 marked a significant year for Comfort Systems, with its gross profit nearing the billion-dollar mark. However, data for 2024 remains incomplete, leaving room for speculation on future trends. This comparison underscores the diverse strategies and market conditions influencing these two industry leaders.
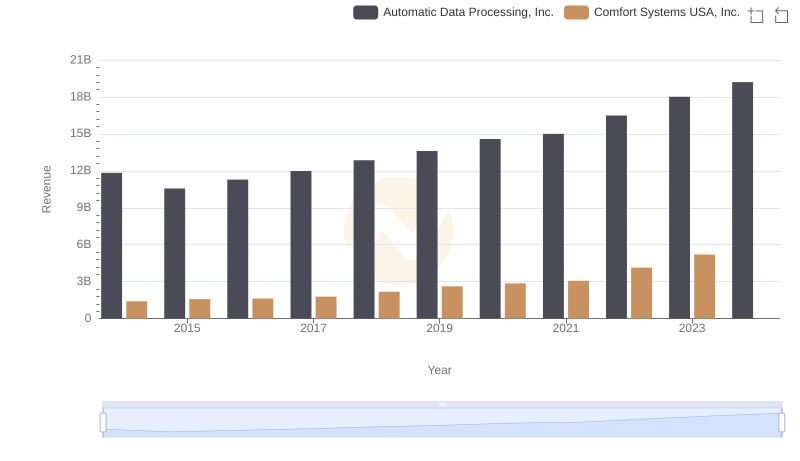
Automatic Data Processing, Inc. vs Comfort Systems USA, Inc.: Examining Key Revenue Metrics
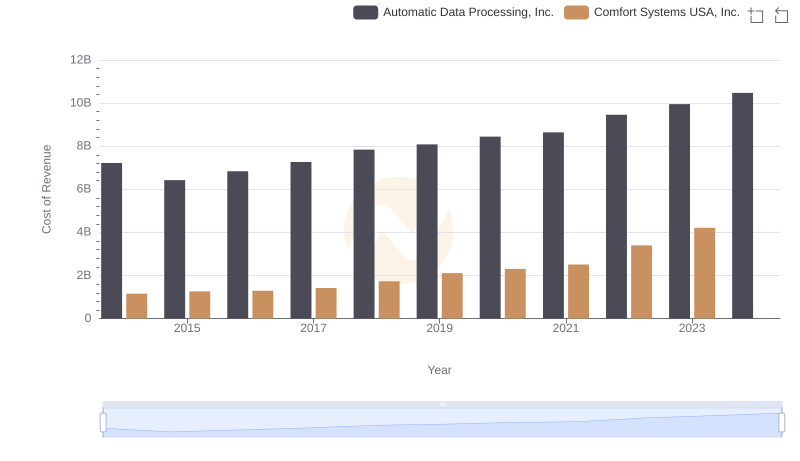
Automatic Data Processing, Inc. vs Comfort Systems USA, Inc.: Efficiency in Cost of Revenue Explored

Gross Profit Trends Compared: Automatic Data Processing, Inc. vs ZTO Express (Cayman) Inc.
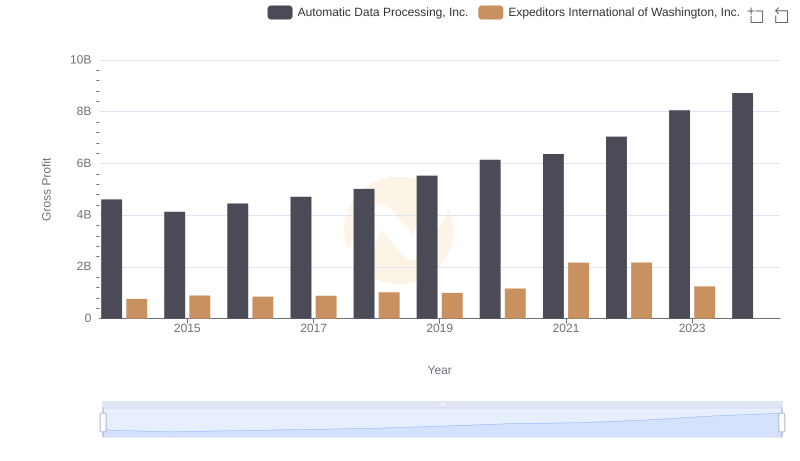
Gross Profit Comparison: Automatic Data Processing, Inc. and Expeditors International of Washington, Inc. Trends
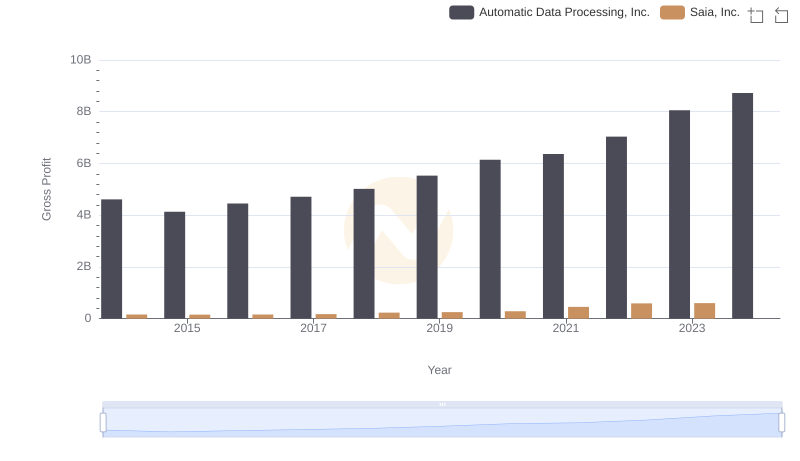
Automatic Data Processing, Inc. and Saia, Inc.: A Detailed Gross Profit Analysis

Key Insights on Gross Profit: Automatic Data Processing, Inc. vs AECOM
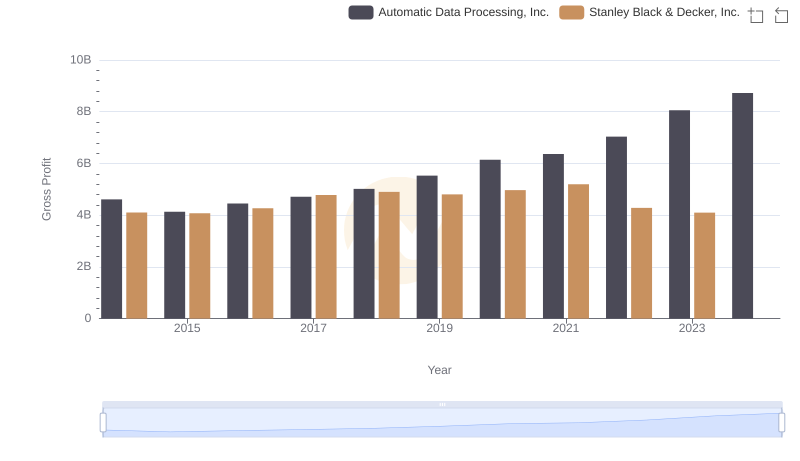
Key Insights on Gross Profit: Automatic Data Processing, Inc. vs Stanley Black & Decker, Inc.
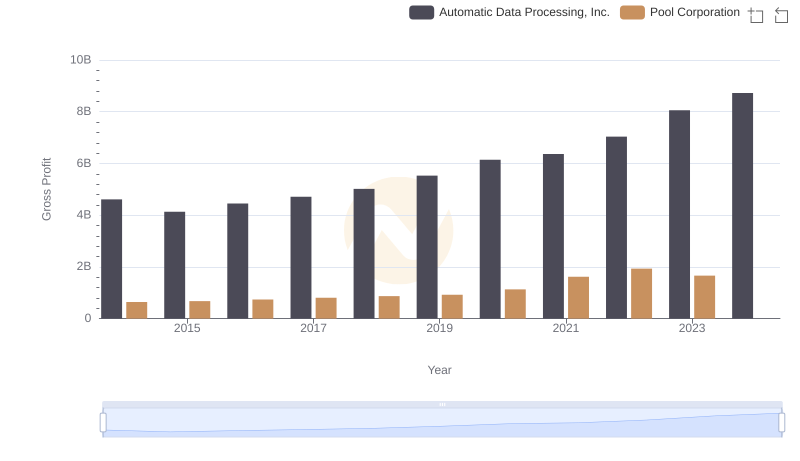
Gross Profit Comparison: Automatic Data Processing, Inc. and Pool Corporation Trends
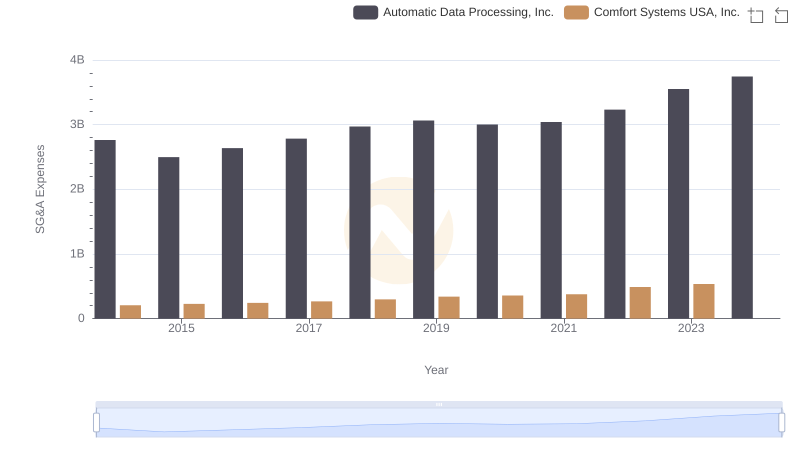
Automatic Data Processing, Inc. or Comfort Systems USA, Inc.: Who Manages SG&A Costs Better?
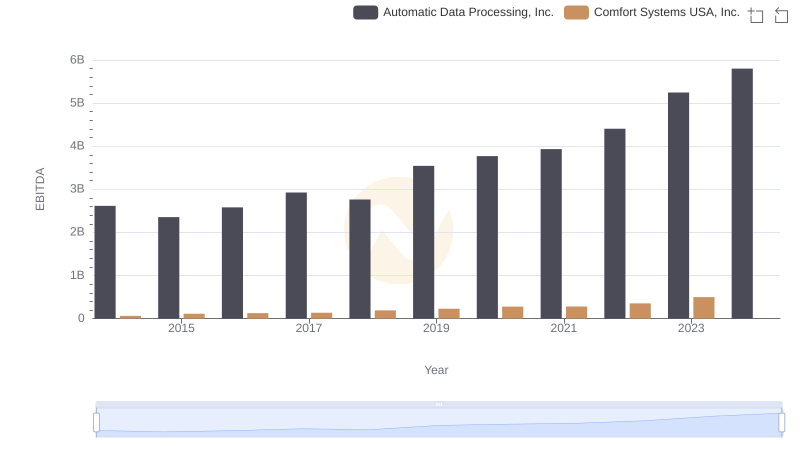
EBITDA Analysis: Evaluating Automatic Data Processing, Inc. Against Comfort Systems USA, Inc.