| __timestamp | Axon Enterprise, Inc. | XPO Logistics, Inc. |
|---|---|---|
| Wednesday, January 1, 2014 | 101548000 | 381600000 |
| Thursday, January 1, 2015 | 128647000 | 1084800000 |
| Friday, January 1, 2016 | 170536000 | 2139300000 |
| Sunday, January 1, 2017 | 207088000 | 2279700000 |
| Monday, January 1, 2018 | 258583000 | 2541000000 |
| Tuesday, January 1, 2019 | 307286000 | 2666000000 |
| Wednesday, January 1, 2020 | 416331000 | 2563000000 |
| Friday, January 1, 2021 | 540910000 | 1994000000 |
| Saturday, January 1, 2022 | 728638000 | 1227000000 |
| Sunday, January 1, 2023 | 955382000 | 770000000 |
| Monday, January 1, 2024 | 915000000 |
Unveiling the hidden dimensions of data
In the dynamic world of business, understanding the financial health of companies is crucial. This analysis delves into the gross profit performance of Axon Enterprise, Inc. and XPO Logistics, Inc. over the past decade. From 2014 to 2023, Axon Enterprise, Inc. has shown a remarkable growth trajectory, with its gross profit surging by over 840%, reaching nearly $956 million in 2023. In contrast, XPO Logistics, Inc. experienced a more volatile journey. Despite peaking in 2019 with a gross profit of approximately $2.67 billion, it saw a decline to around $770 million by 2023, marking a 71% drop. This comparison highlights the resilience and strategic prowess of Axon Enterprise, Inc. in navigating market challenges, while XPO Logistics, Inc. faces the task of regaining its former financial strength.

Who Generates More Revenue? Axon Enterprise, Inc. or XPO Logistics, Inc.
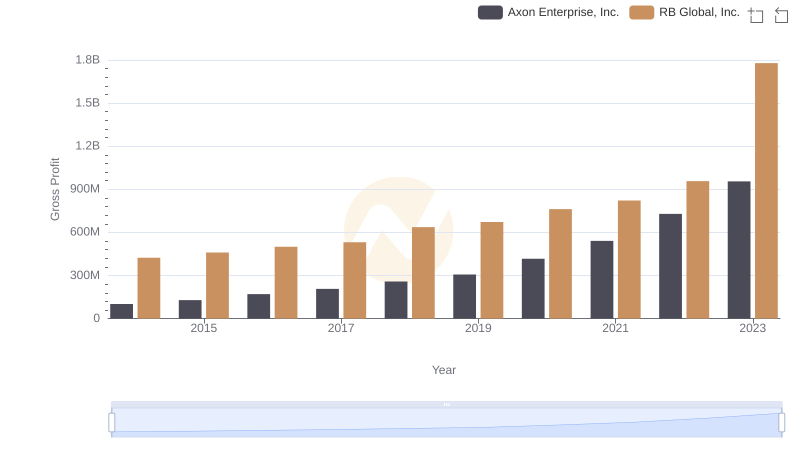
Gross Profit Trends Compared: Axon Enterprise, Inc. vs RB Global, Inc.
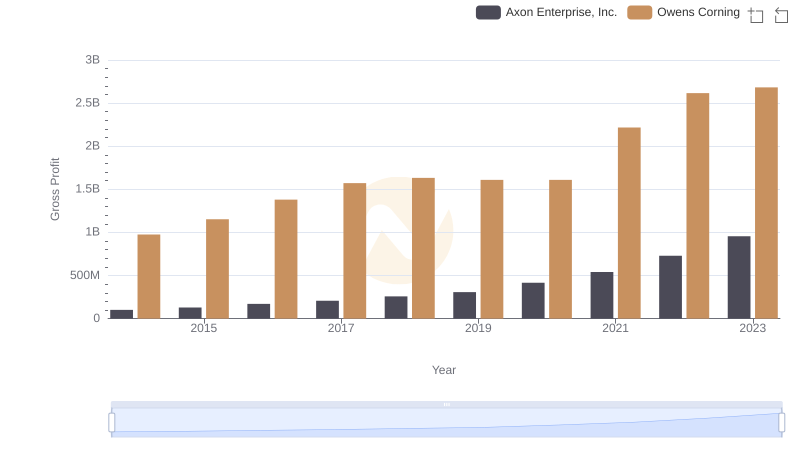
Gross Profit Analysis: Comparing Axon Enterprise, Inc. and Owens Corning
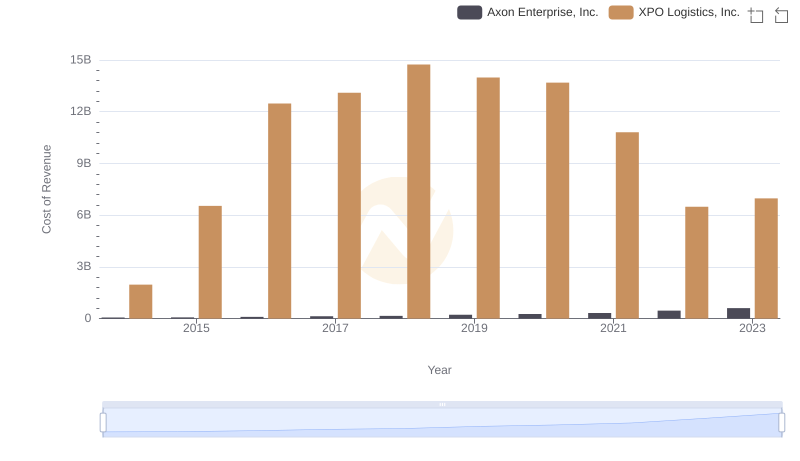
Comparing Cost of Revenue Efficiency: Axon Enterprise, Inc. vs XPO Logistics, Inc.
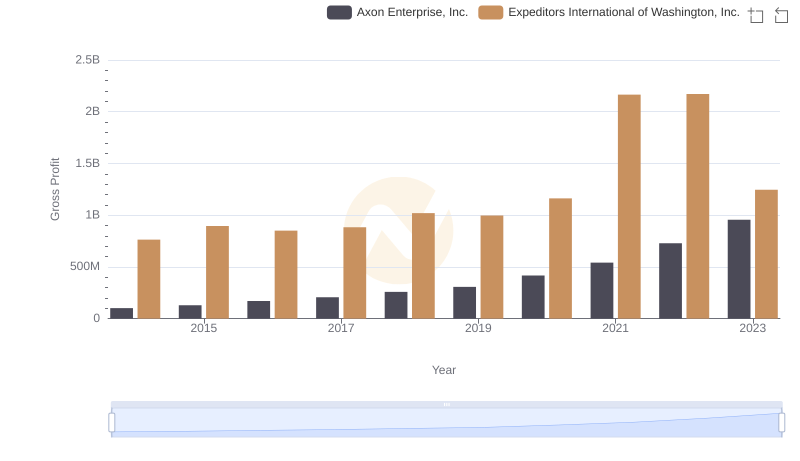
Who Generates Higher Gross Profit? Axon Enterprise, Inc. or Expeditors International of Washington, Inc.
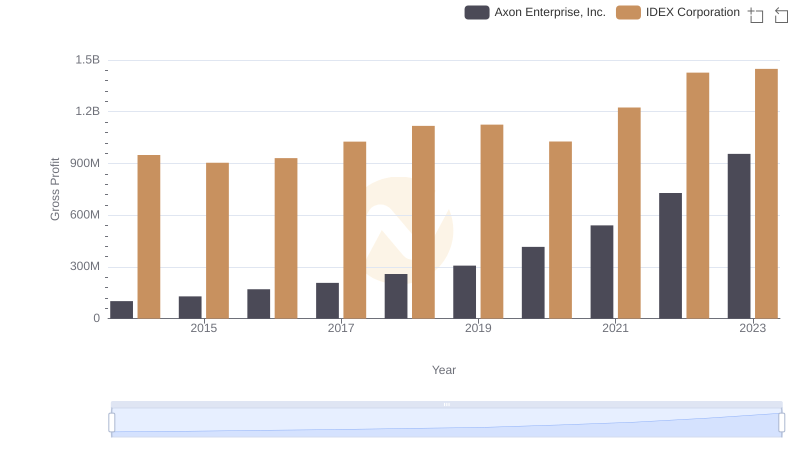
Key Insights on Gross Profit: Axon Enterprise, Inc. vs IDEX Corporation
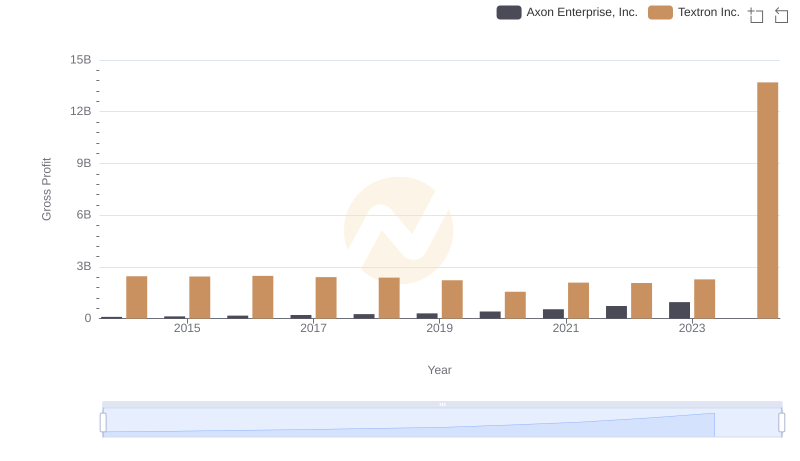
Who Generates Higher Gross Profit? Axon Enterprise, Inc. or Textron Inc.
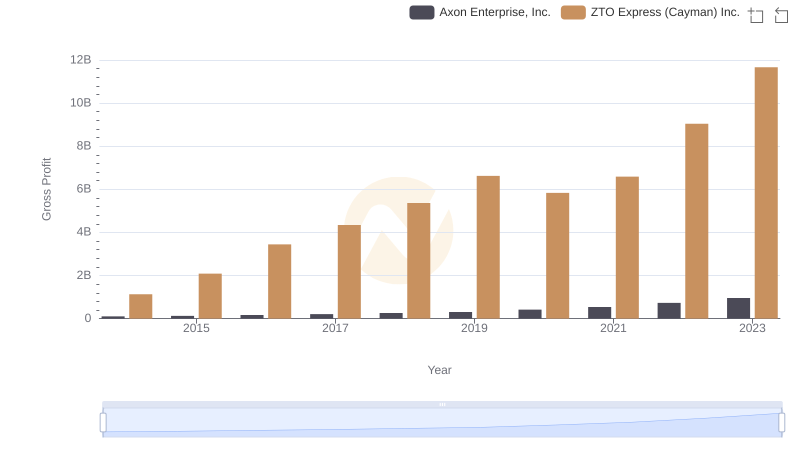
Axon Enterprise, Inc. and ZTO Express (Cayman) Inc.: A Detailed Gross Profit Analysis
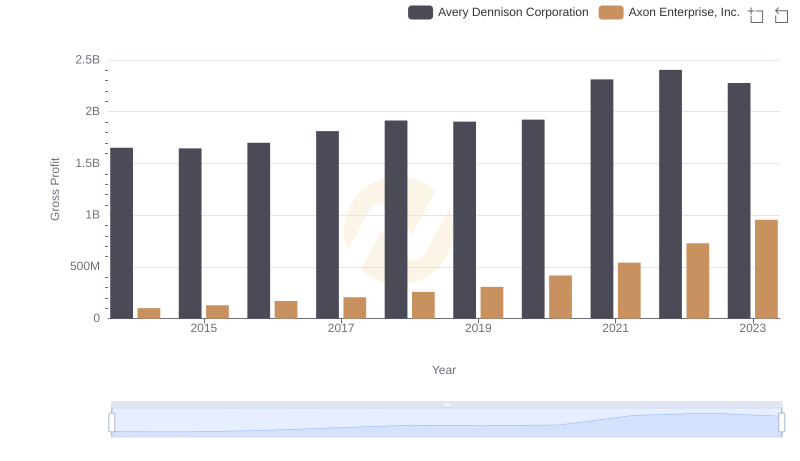
Who Generates Higher Gross Profit? Axon Enterprise, Inc. or Avery Dennison Corporation
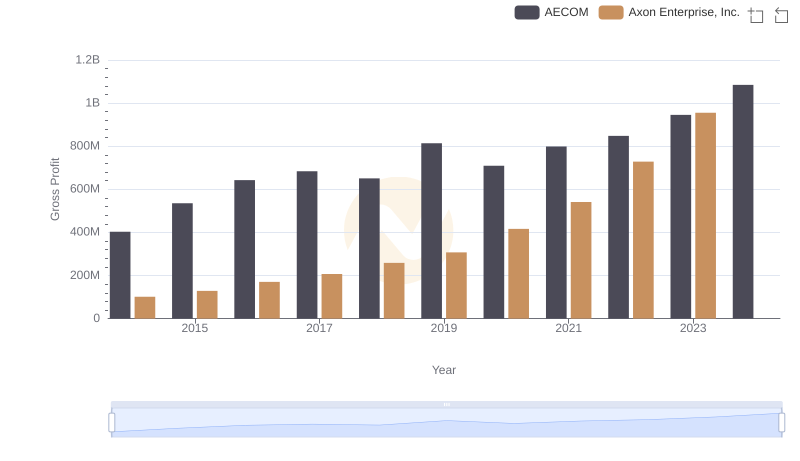
Gross Profit Comparison: Axon Enterprise, Inc. and AECOM Trends
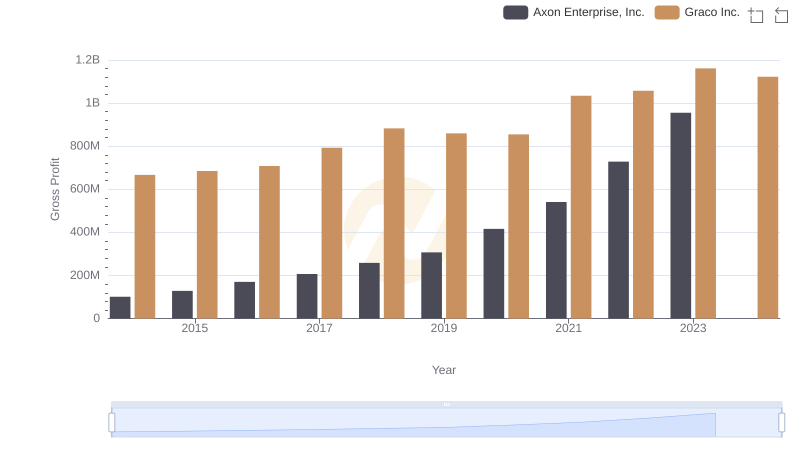
Axon Enterprise, Inc. vs Graco Inc.: A Gross Profit Performance Breakdown