| __timestamp | AMETEK, Inc. | Builders FirstSource, Inc. |
|---|---|---|
| Wednesday, January 1, 2014 | 1424947000 | 356997000 |
| Thursday, January 1, 2015 | 1425015000 | 901458000 |
| Friday, January 1, 2016 | 1264867000 | 1596748000 |
| Sunday, January 1, 2017 | 1448739000 | 1727391000 |
| Monday, January 1, 2018 | 1659562000 | 1922940000 |
| Tuesday, January 1, 2019 | 1787660000 | 1976829000 |
| Wednesday, January 1, 2020 | 1543514000 | 2222584000 |
| Friday, January 1, 2021 | 1912614000 | 5850956000 |
| Saturday, January 1, 2022 | 2145269000 | 7744379000 |
| Sunday, January 1, 2023 | 2384465001 | 6012334000 |
| Monday, January 1, 2024 | 6941180000 |
Infusing magic into the data realm
In the ever-evolving landscape of industrial manufacturing and building materials, AMETEK, Inc. and Builders FirstSource, Inc. have emerged as formidable players. Over the past decade, these companies have showcased distinct growth trajectories in their gross profit margins.
From 2014 to 2023, AMETEK, Inc. experienced a steady increase in gross profit, growing by approximately 67% from 2014 to 2023. In contrast, Builders FirstSource, Inc. demonstrated a more volatile yet impressive growth, with a staggering increase of over 1,500% during the same period. This dramatic rise is particularly notable between 2020 and 2022, where Builders FirstSource, Inc. saw its gross profit more than triple, reflecting its strategic expansions and market adaptations.
These trends highlight the dynamic nature of the industry and the varying strategies employed by these two giants to navigate economic challenges and capitalize on market opportunities.
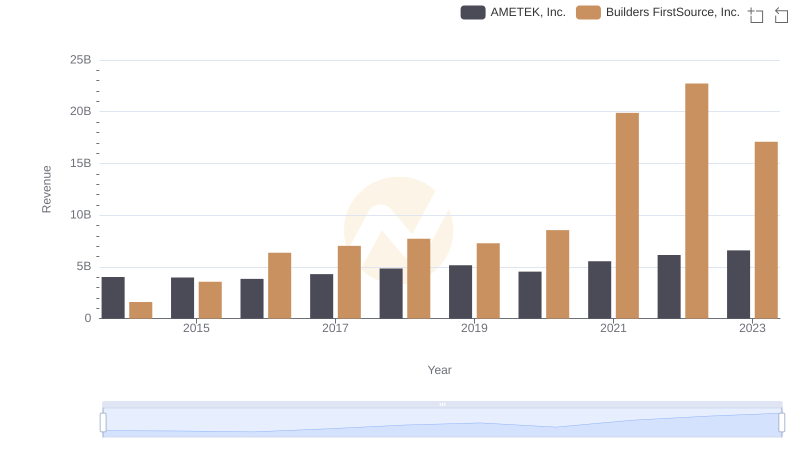
Breaking Down Revenue Trends: AMETEK, Inc. vs Builders FirstSource, Inc.
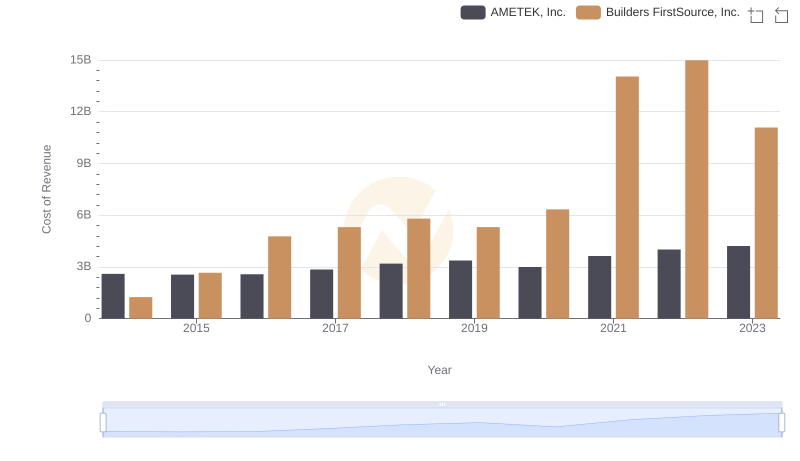
Cost of Revenue Comparison: AMETEK, Inc. vs Builders FirstSource, Inc.
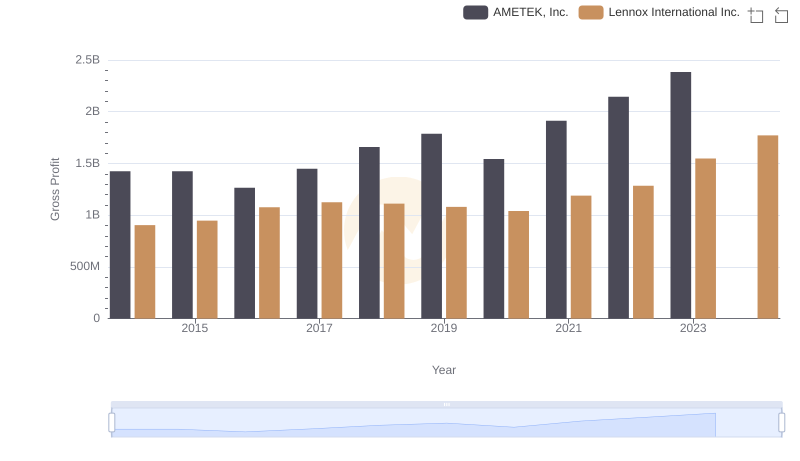
Gross Profit Analysis: Comparing AMETEK, Inc. and Lennox International Inc.
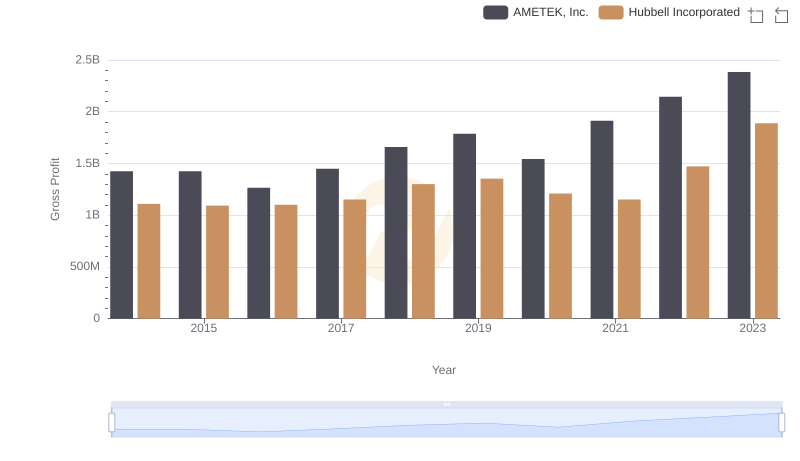
Gross Profit Analysis: Comparing AMETEK, Inc. and Hubbell Incorporated

Gross Profit Trends Compared: AMETEK, Inc. vs EMCOR Group, Inc.
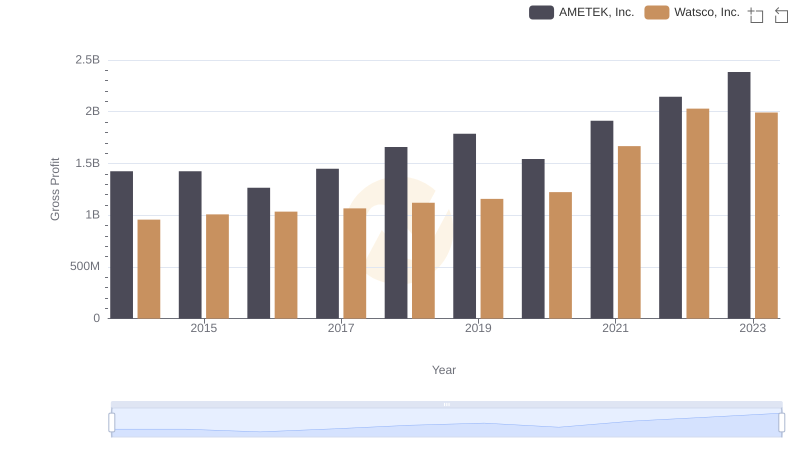
AMETEK, Inc. vs Watsco, Inc.: A Gross Profit Performance Breakdown
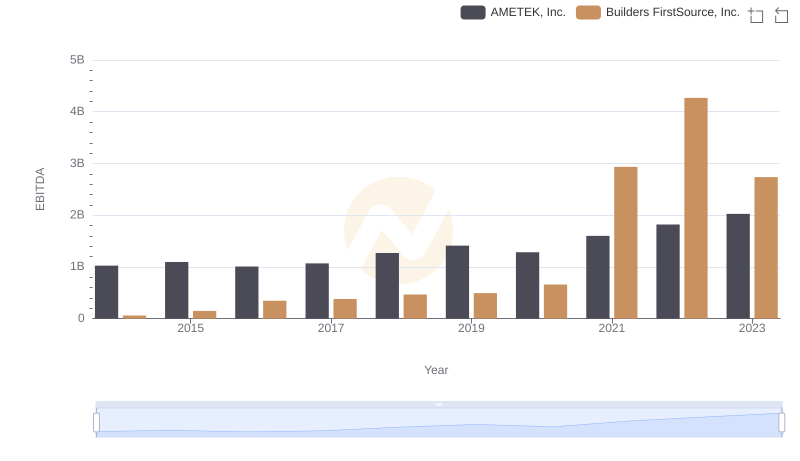
EBITDA Metrics Evaluated: AMETEK, Inc. vs Builders FirstSource, Inc.