| __timestamp | RB Global, Inc. | Westinghouse Air Brake Technologies Corporation |
|---|---|---|
| Wednesday, January 1, 2014 | 178851000 | 588370000 |
| Thursday, January 1, 2015 | 211417000 | 672301000 |
| Friday, January 1, 2016 | 174791291 | 535893000 |
| Sunday, January 1, 2017 | 168379000 | 532795000 |
| Monday, January 1, 2018 | 263653000 | 584199000 |
| Tuesday, January 1, 2019 | 322140110 | 1067300000 |
| Wednesday, January 1, 2020 | 358617000 | 1229400000 |
| Friday, January 1, 2021 | 339928424 | 1405000000 |
| Saturday, January 1, 2022 | 557399151 | 1519000000 |
| Sunday, January 1, 2023 | 975874087 | 1787000000 |
| Monday, January 1, 2024 | 761100000 | 1609000000 |
Unlocking the unknown
In the competitive landscape of industrial technology, Westinghouse Air Brake Technologies Corporation (WAB) and RB Global, Inc. have showcased remarkable financial trajectories over the past decade. From 2014 to 2023, WAB consistently outperformed RB Global in terms of EBITDA, a key indicator of financial health and operational efficiency.
WAB's EBITDA surged by approximately 204% from 2014 to 2023, reflecting its robust growth strategy and market adaptability. In contrast, RB Global experienced a significant 446% increase in EBITDA during the same period, indicating a strong upward trend despite starting from a lower base.
The year 2023 marked a pinnacle for both companies, with WAB achieving an EBITDA of nearly 1.8 billion, while RB Global reached close to 976 million. This analysis underscores the dynamic shifts in the industrial sector, highlighting the importance of strategic financial management.
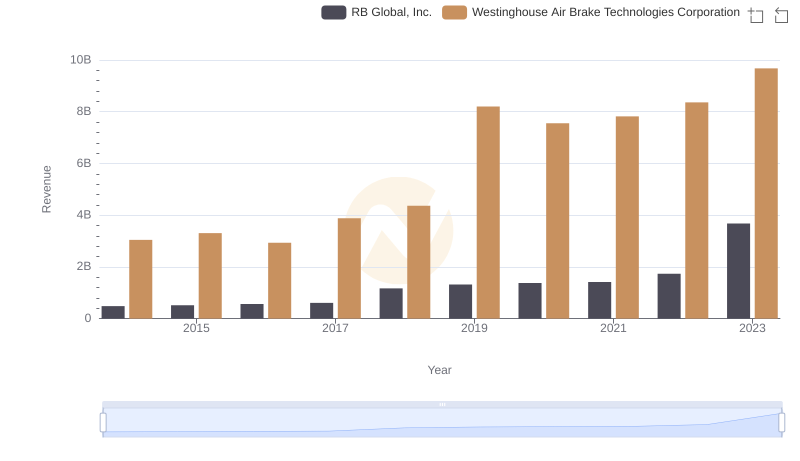
Annual Revenue Comparison: Westinghouse Air Brake Technologies Corporation vs RB Global, Inc.
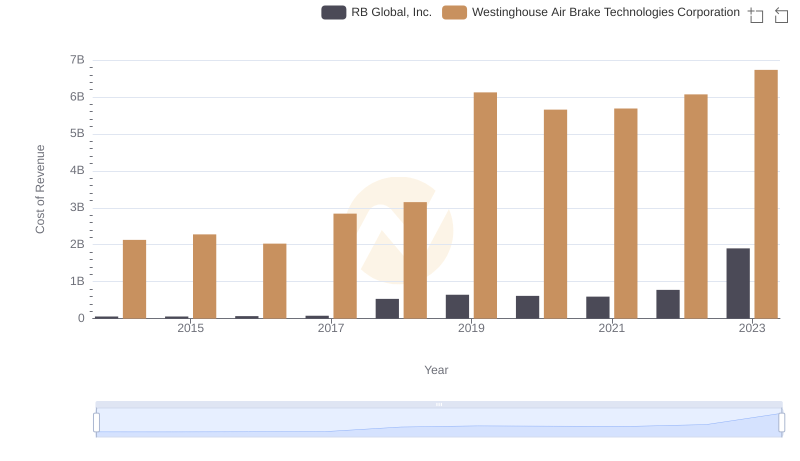
Comparing Cost of Revenue Efficiency: Westinghouse Air Brake Technologies Corporation vs RB Global, Inc.
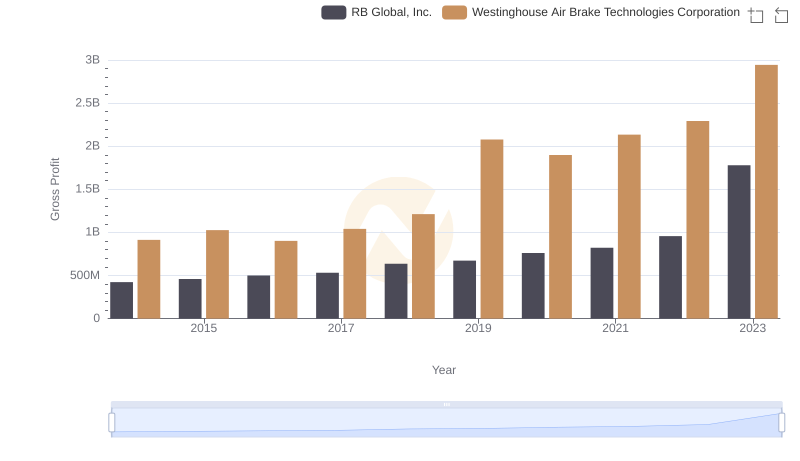
Gross Profit Comparison: Westinghouse Air Brake Technologies Corporation and RB Global, Inc. Trends
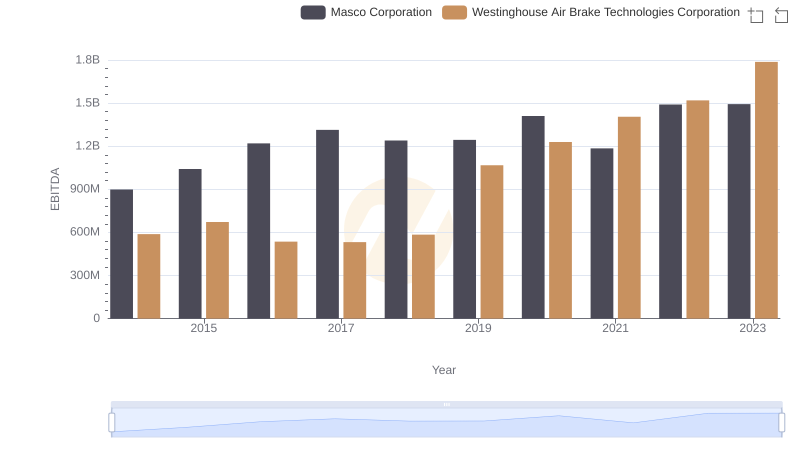
Comparative EBITDA Analysis: Westinghouse Air Brake Technologies Corporation vs Masco Corporation
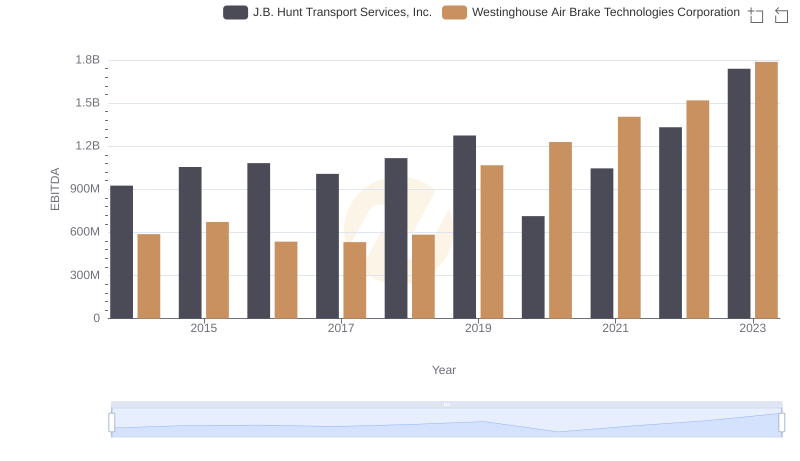
A Professional Review of EBITDA: Westinghouse Air Brake Technologies Corporation Compared to J.B. Hunt Transport Services, Inc.
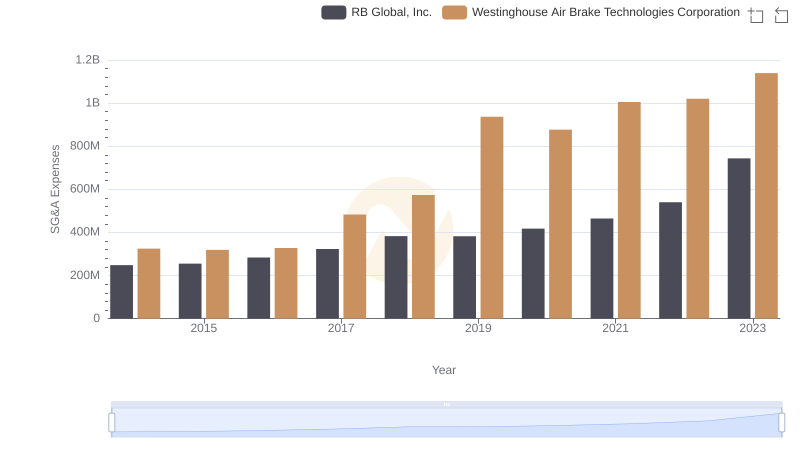
Westinghouse Air Brake Technologies Corporation and RB Global, Inc.: SG&A Spending Patterns Compared
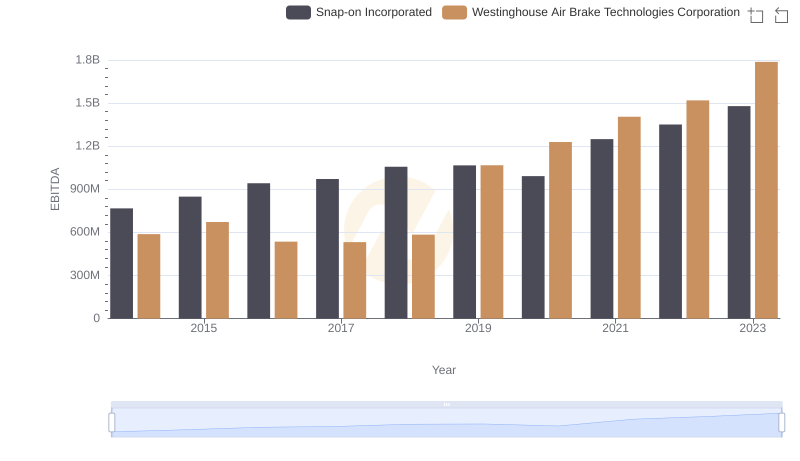
EBITDA Analysis: Evaluating Westinghouse Air Brake Technologies Corporation Against Snap-on Incorporated
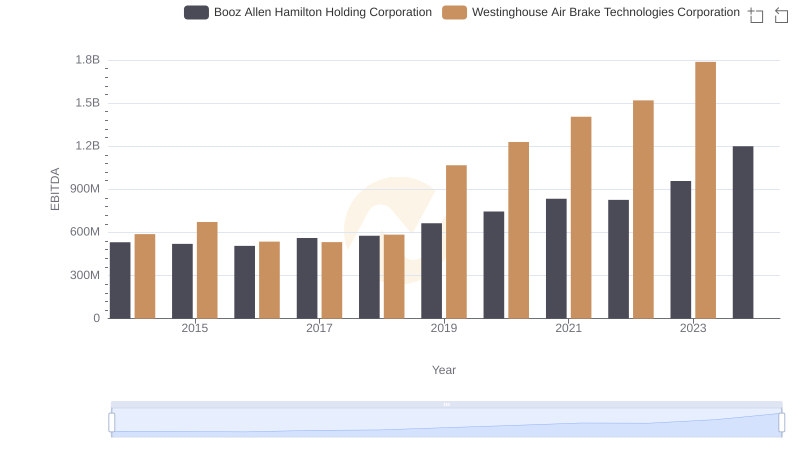
Comprehensive EBITDA Comparison: Westinghouse Air Brake Technologies Corporation vs Booz Allen Hamilton Holding Corporation
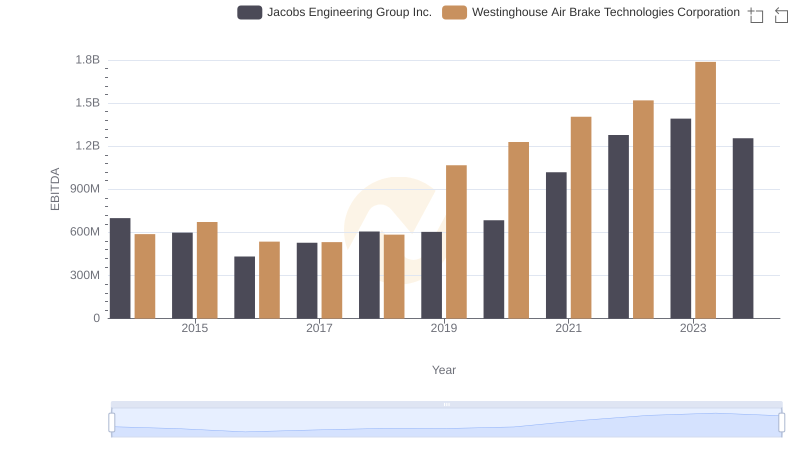
EBITDA Performance Review: Westinghouse Air Brake Technologies Corporation vs Jacobs Engineering Group Inc.
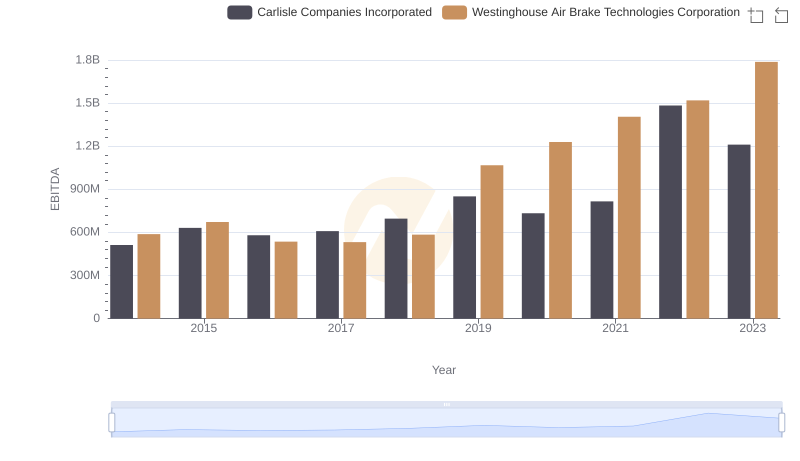
A Side-by-Side Analysis of EBITDA: Westinghouse Air Brake Technologies Corporation and Carlisle Companies Incorporated
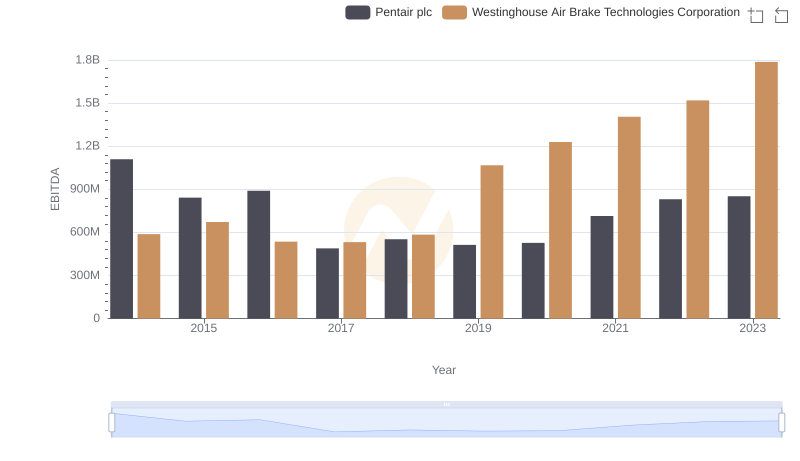
EBITDA Metrics Evaluated: Westinghouse Air Brake Technologies Corporation vs Pentair plc
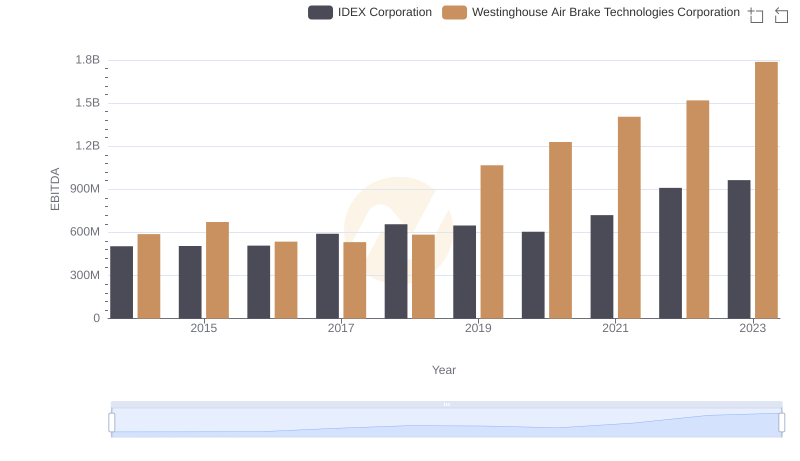
A Professional Review of EBITDA: Westinghouse Air Brake Technologies Corporation Compared to IDEX Corporation