| __timestamp | Masco Corporation | Old Dominion Freight Line, Inc. |
|---|---|---|
| Wednesday, January 1, 2014 | 899000000 | 585590000 |
| Thursday, January 1, 2015 | 1041000000 | 660570000 |
| Friday, January 1, 2016 | 1220000000 | 671786000 |
| Sunday, January 1, 2017 | 1314000000 | 783749000 |
| Monday, January 1, 2018 | 1240000000 | 1046059000 |
| Tuesday, January 1, 2019 | 1244000000 | 1078007000 |
| Wednesday, January 1, 2020 | 1410000000 | 1168149000 |
| Friday, January 1, 2021 | 1185000000 | 1651501000 |
| Saturday, January 1, 2022 | 1490000000 | 2118962000 |
| Sunday, January 1, 2023 | 1493000000 | 1972689000 |
| Monday, January 1, 2024 | 1410000000 |
Cracking the code
In the ever-evolving landscape of the transportation and home improvement sectors, Old Dominion Freight Line, Inc. and Masco Corporation have demonstrated remarkable EBITDA growth over the past decade. From 2014 to 2023, Old Dominion Freight Line, Inc. has seen its EBITDA surge by an impressive 237%, reaching its peak in 2022. Meanwhile, Masco Corporation has experienced a steady increase of 66% in the same period, showcasing resilience and adaptability in a competitive market.
Old Dominion's strategic expansions and operational efficiencies have propelled it to the forefront, particularly evident in its 2022 EBITDA, which was nearly 42% higher than Masco's. On the other hand, Masco's consistent performance highlights its strong market position in the home improvement industry. As we look to the future, these companies continue to set benchmarks in their respective fields, offering valuable insights into successful business strategies.
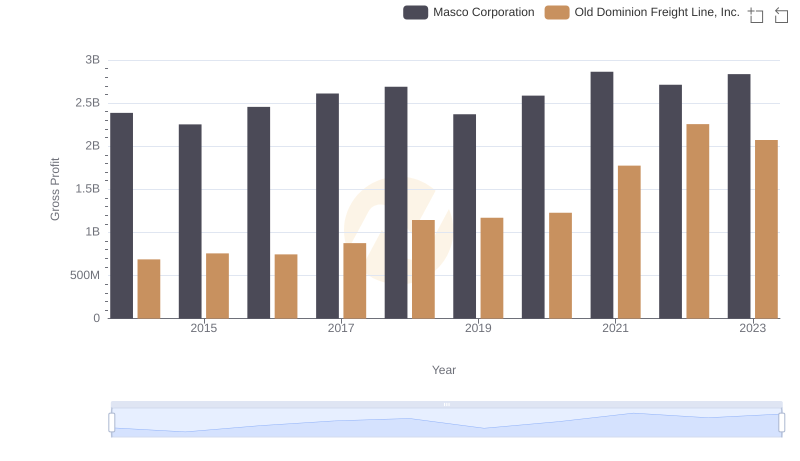
Gross Profit Trends Compared: Old Dominion Freight Line, Inc. vs Masco Corporation
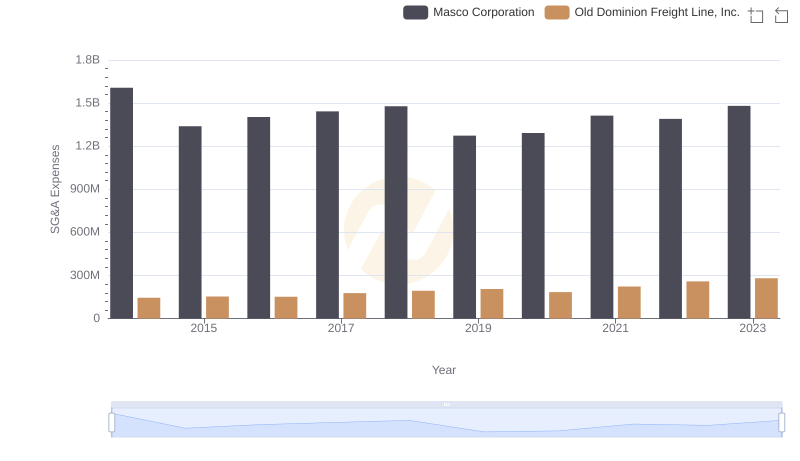
Old Dominion Freight Line, Inc. vs Masco Corporation: SG&A Expense Trends
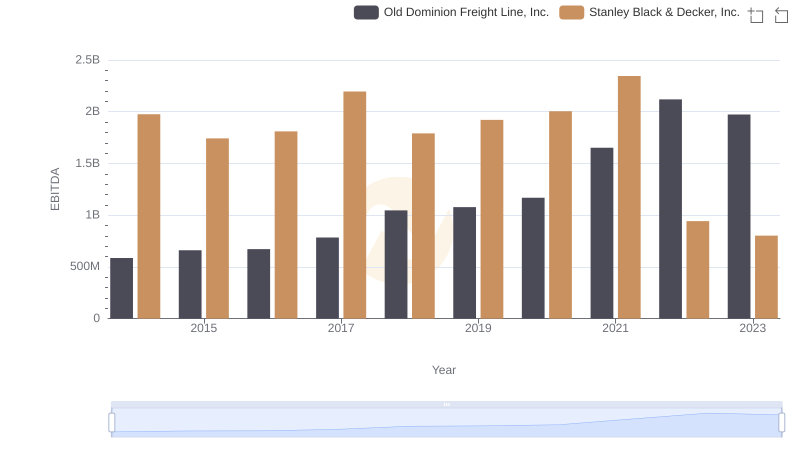
Old Dominion Freight Line, Inc. vs Stanley Black & Decker, Inc.: In-Depth EBITDA Performance Comparison
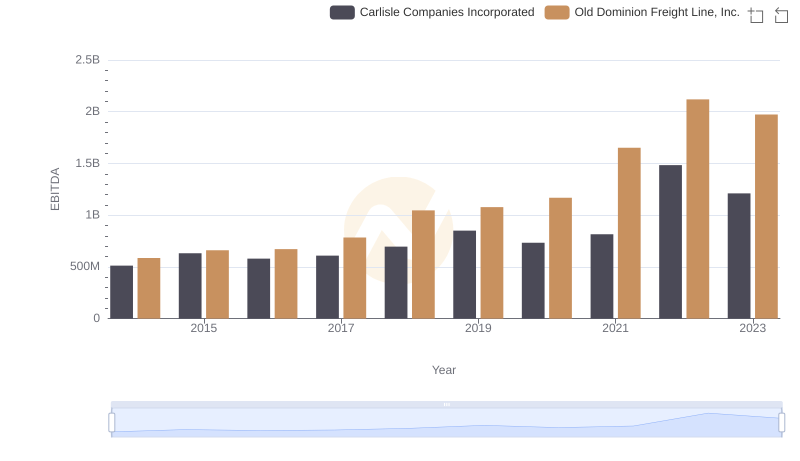
Old Dominion Freight Line, Inc. and Carlisle Companies Incorporated: A Detailed Examination of EBITDA Performance
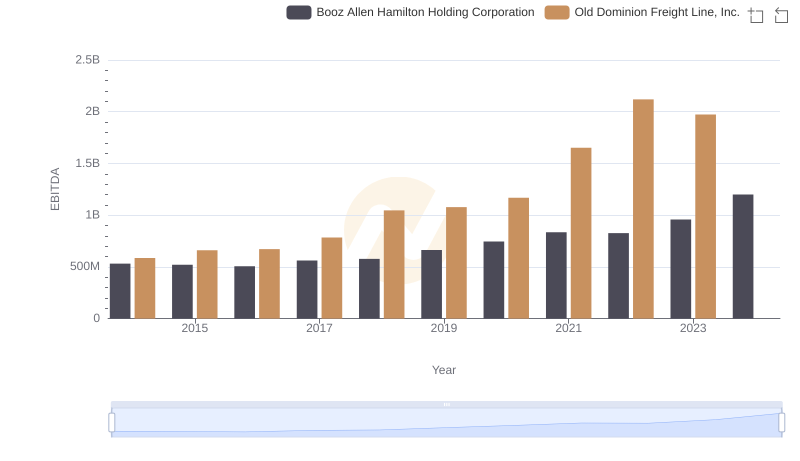
A Professional Review of EBITDA: Old Dominion Freight Line, Inc. Compared to Booz Allen Hamilton Holding Corporation

EBITDA Performance Review: Old Dominion Freight Line, Inc. vs Pentair plc
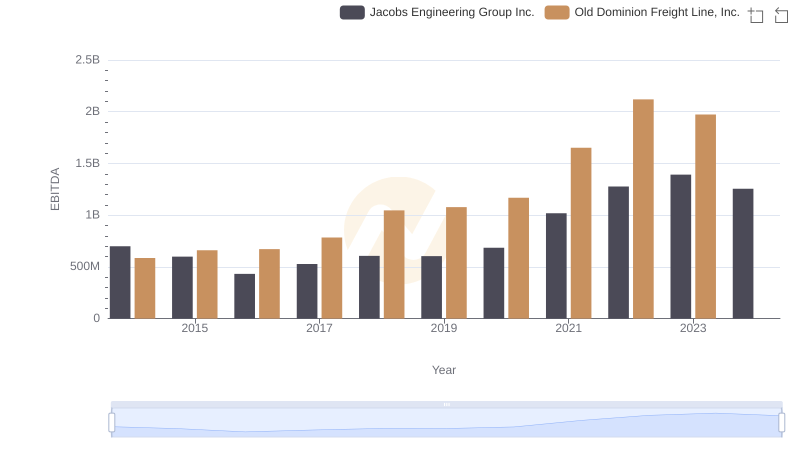
EBITDA Metrics Evaluated: Old Dominion Freight Line, Inc. vs Jacobs Engineering Group Inc.
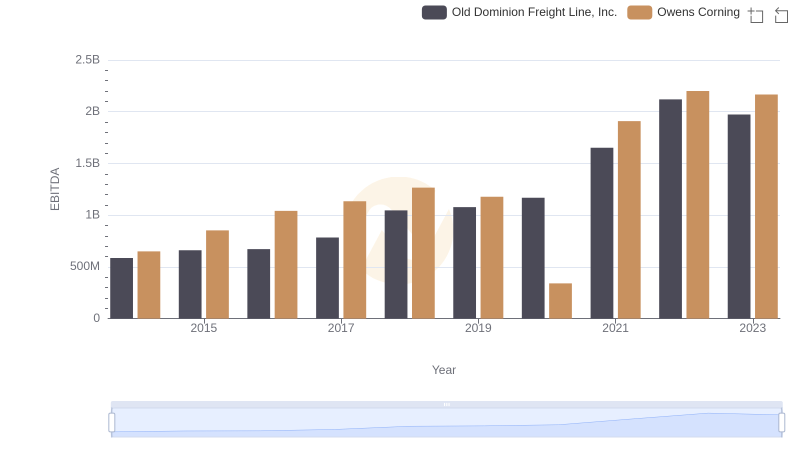
A Professional Review of EBITDA: Old Dominion Freight Line, Inc. Compared to Owens Corning