| __timestamp | Masco Corporation | Old Dominion Freight Line, Inc. |
|---|---|---|
| Wednesday, January 1, 2014 | 2387000000 | 687488000 |
| Thursday, January 1, 2015 | 2253000000 | 757499000 |
| Friday, January 1, 2016 | 2456000000 | 744627000 |
| Sunday, January 1, 2017 | 2611000000 | 875380000 |
| Monday, January 1, 2018 | 2689000000 | 1144243000 |
| Tuesday, January 1, 2019 | 2371000000 | 1170216000 |
| Wednesday, January 1, 2020 | 2587000000 | 1228598000 |
| Friday, January 1, 2021 | 2863000000 | 1775060000 |
| Saturday, January 1, 2022 | 2713000000 | 2256126000 |
| Sunday, January 1, 2023 | 2836000000 | 2072199000 |
| Monday, January 1, 2024 | 2831000000 |
Unveiling the hidden dimensions of data
In the competitive landscape of American business, Old Dominion Freight Line, Inc. and Masco Corporation have carved distinct paths in their financial journeys. From 2014 to 2023, Masco Corporation consistently maintained a higher gross profit, peaking in 2021 with a 20% increase from its 2014 figures. Meanwhile, Old Dominion Freight Line, Inc. showcased a remarkable growth trajectory, with its gross profit surging by over 200% during the same period. This growth is particularly notable in 2022, where Old Dominion's gross profit nearly matched Masco's, highlighting its rapid ascent in the logistics sector. The data reveals a fascinating narrative of resilience and strategic growth, underscoring the dynamic nature of these industries. As we delve into these trends, it becomes evident that while Masco holds a steady lead, Old Dominion's aggressive growth strategy is reshaping the competitive landscape.
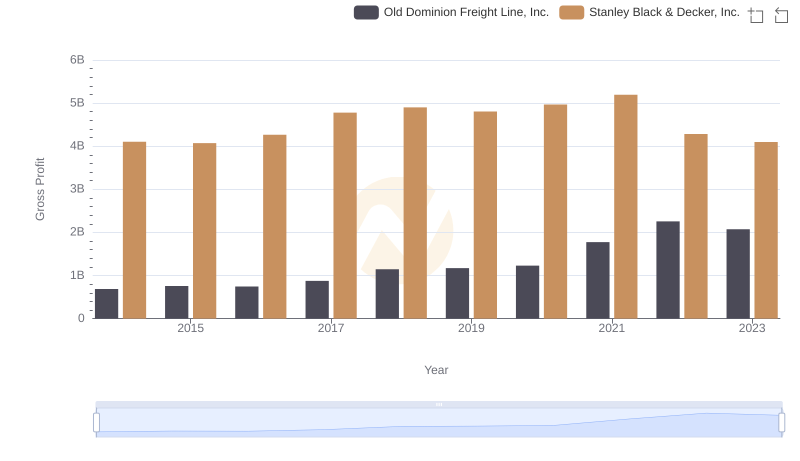
Gross Profit Comparison: Old Dominion Freight Line, Inc. and Stanley Black & Decker, Inc. Trends
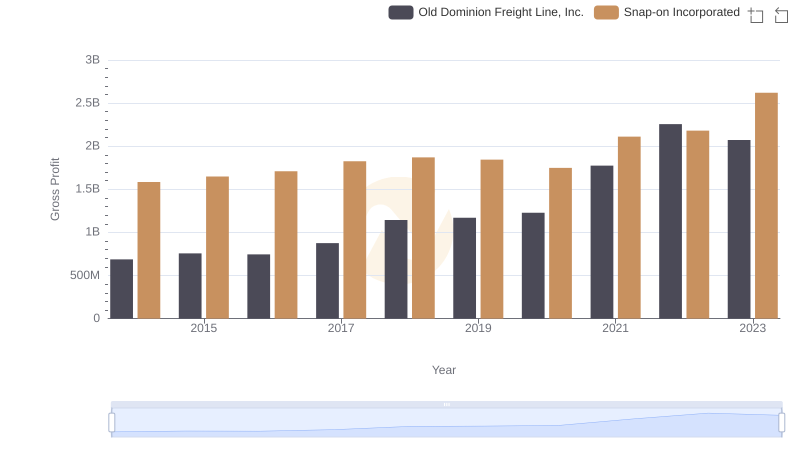
Old Dominion Freight Line, Inc. vs Snap-on Incorporated: A Gross Profit Performance Breakdown
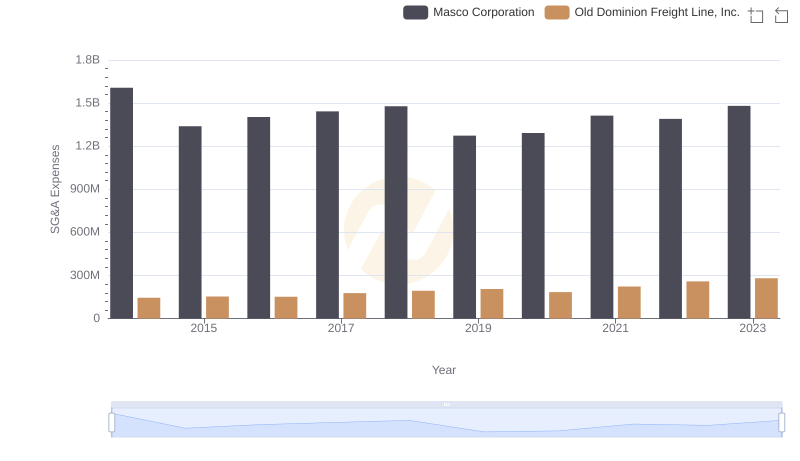
Old Dominion Freight Line, Inc. vs Masco Corporation: SG&A Expense Trends
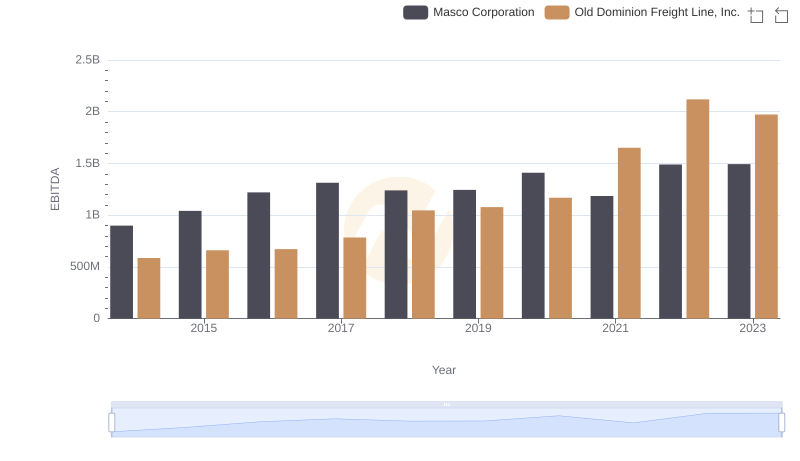
EBITDA Performance Review: Old Dominion Freight Line, Inc. vs Masco Corporation