| __timestamp | Old Dominion Freight Line, Inc. | Stanley Black & Decker, Inc. |
|---|---|---|
| Wednesday, January 1, 2014 | 585590000 | 1975400000 |
| Thursday, January 1, 2015 | 660570000 | 1741900000 |
| Friday, January 1, 2016 | 671786000 | 1810200000 |
| Sunday, January 1, 2017 | 783749000 | 2196000000 |
| Monday, January 1, 2018 | 1046059000 | 1791200000 |
| Tuesday, January 1, 2019 | 1078007000 | 1920600000 |
| Wednesday, January 1, 2020 | 1168149000 | 2004200000 |
| Friday, January 1, 2021 | 1651501000 | 2345500000 |
| Saturday, January 1, 2022 | 2118962000 | 942800000 |
| Sunday, January 1, 2023 | 1972689000 | 802700000 |
| Monday, January 1, 2024 | 286300000 |
Unleashing the power of data
In the ever-evolving landscape of American industry, Old Dominion Freight Line, Inc. and Stanley Black & Decker, Inc. stand as titans in their respective fields. Over the past decade, these companies have showcased remarkable EBITDA performance, reflecting their strategic prowess and market adaptability.
From 2014 to 2023, Old Dominion Freight Line's EBITDA surged by an impressive 237%, peaking in 2022. This growth underscores the company's robust logistics operations and strategic expansions. In contrast, Stanley Black & Decker experienced a more volatile trajectory, with a notable decline of 59% in 2023 compared to its 2021 peak. This shift highlights the challenges faced by the manufacturing sector amidst global supply chain disruptions.
While Old Dominion capitalized on the e-commerce boom, Stanley Black & Decker's recent downturn suggests a need for strategic recalibration. As these giants navigate the future, their contrasting paths offer valuable lessons in resilience and adaptation.
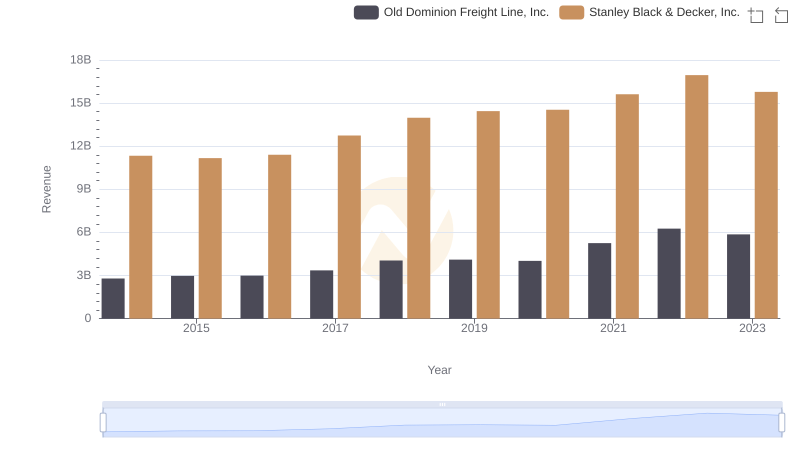
Comparing Revenue Performance: Old Dominion Freight Line, Inc. or Stanley Black & Decker, Inc.?
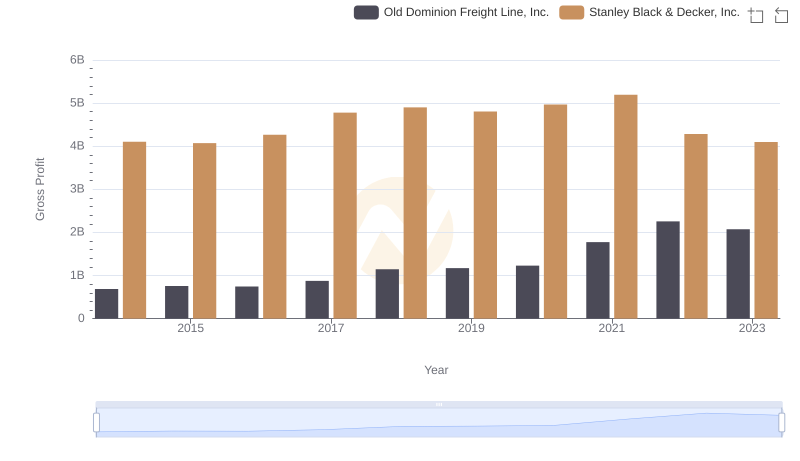
Gross Profit Comparison: Old Dominion Freight Line, Inc. and Stanley Black & Decker, Inc. Trends
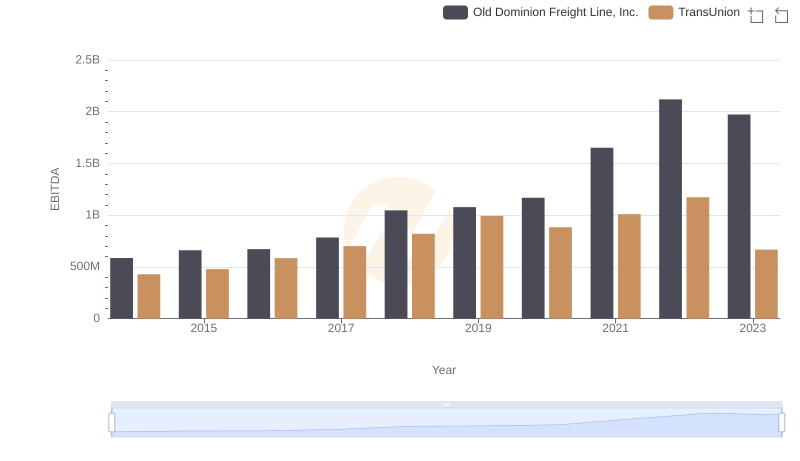
A Side-by-Side Analysis of EBITDA: Old Dominion Freight Line, Inc. and TransUnion
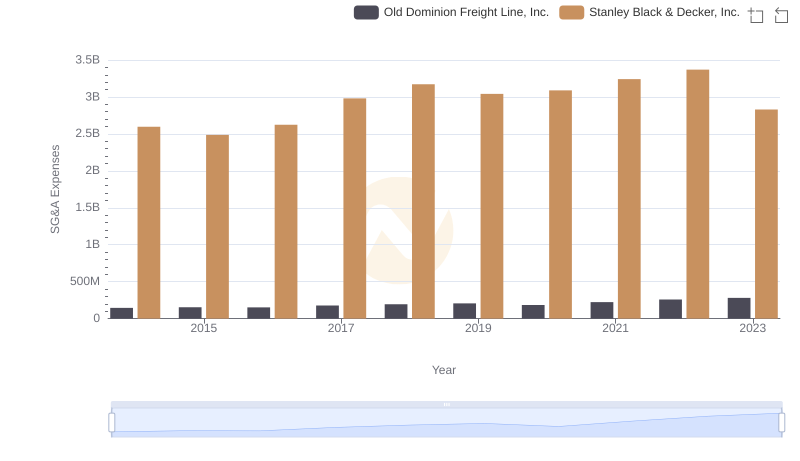
Old Dominion Freight Line, Inc. or Stanley Black & Decker, Inc.: Who Manages SG&A Costs Better?
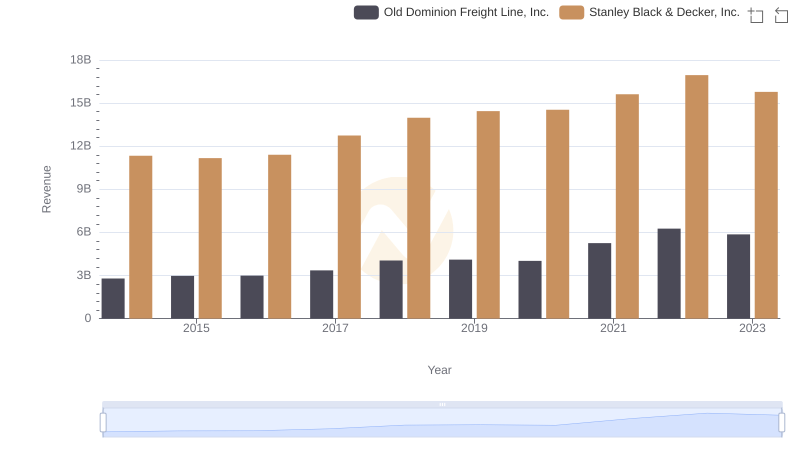
Old Dominion Freight Line, Inc. vs Stanley Black & Decker, Inc.: Annual Revenue Growth Compared
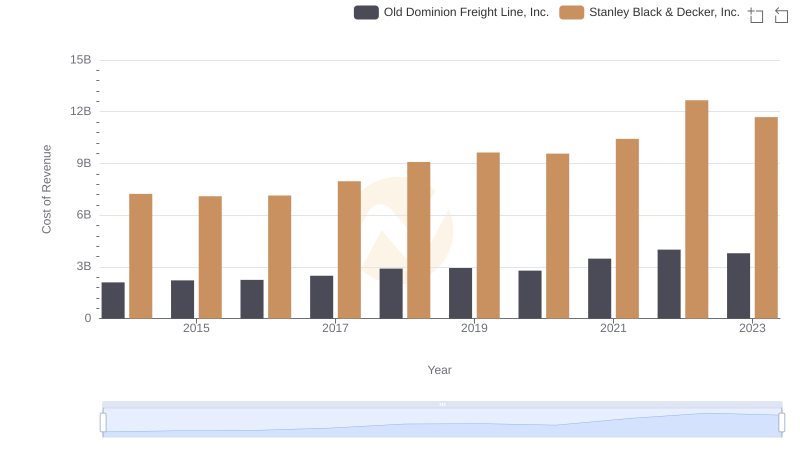
Cost Insights: Breaking Down Old Dominion Freight Line, Inc. and Stanley Black & Decker, Inc.'s Expenses
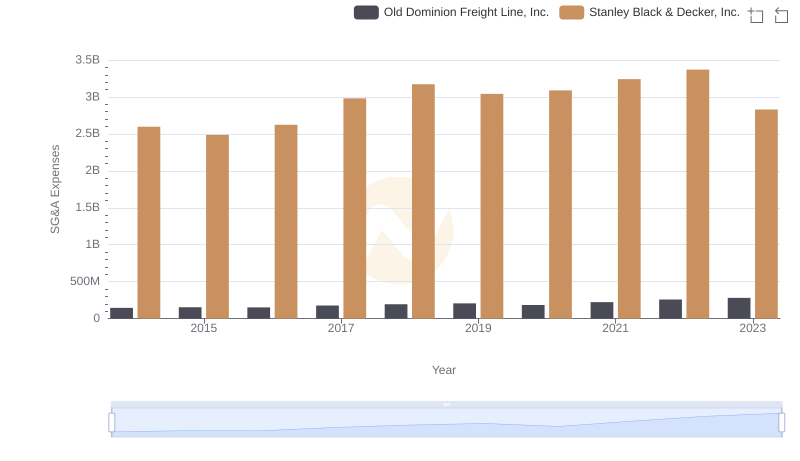
SG&A Efficiency Analysis: Comparing Old Dominion Freight Line, Inc. and Stanley Black & Decker, Inc.
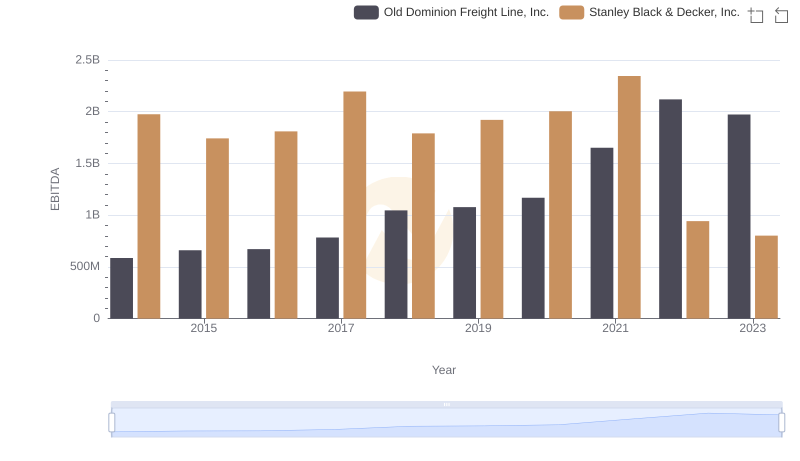
A Professional Review of EBITDA: Old Dominion Freight Line, Inc. Compared to Stanley Black & Decker, Inc.