| __timestamp | Hewlett Packard Enterprise Company | Infosys Limited |
|---|---|---|
| Wednesday, January 1, 2014 | 39486000000 | 5374000000 |
| Thursday, January 1, 2015 | 37168000000 | 5950000000 |
| Friday, January 1, 2016 | 35507000000 | 6446000000 |
| Sunday, January 1, 2017 | 20177000000 | 7001000000 |
| Monday, January 1, 2018 | 21560000000 | 7687000000 |
| Tuesday, January 1, 2019 | 19642000000 | 8552000000 |
| Wednesday, January 1, 2020 | 18513000000 | 8828000000 |
| Friday, January 1, 2021 | 18408000000 | 10996000000 |
| Saturday, January 1, 2022 | 18990000000 | 12709000000 |
| Sunday, January 1, 2023 | 18896000000 | 13096000000 |
| Monday, January 1, 2024 | 20283000000 |
Cracking the code
In the ever-evolving landscape of global technology, Infosys Limited and Hewlett Packard Enterprise (HPE) stand as titans. From 2014 to 2023, these companies have showcased distinct trajectories in their cost of revenue. HPE, a stalwart in enterprise solutions, saw its cost of revenue peak in 2014, with a gradual decline of approximately 52% by 2023. This trend reflects HPE's strategic shift towards more efficient operations and cost management.
Conversely, Infosys, a leader in IT services, demonstrated a steady increase in its cost of revenue, growing by about 144% over the same period. This rise underscores Infosys's expansion and investment in new technologies and markets. Notably, the data for 2024 is incomplete, highlighting the dynamic nature of financial forecasting. As these companies continue to innovate, their financial strategies will remain pivotal in shaping their future.
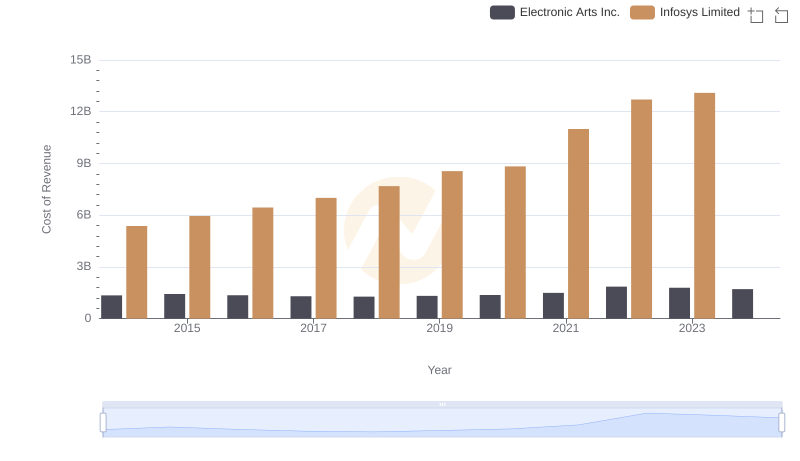
Analyzing Cost of Revenue: Infosys Limited and Electronic Arts Inc.
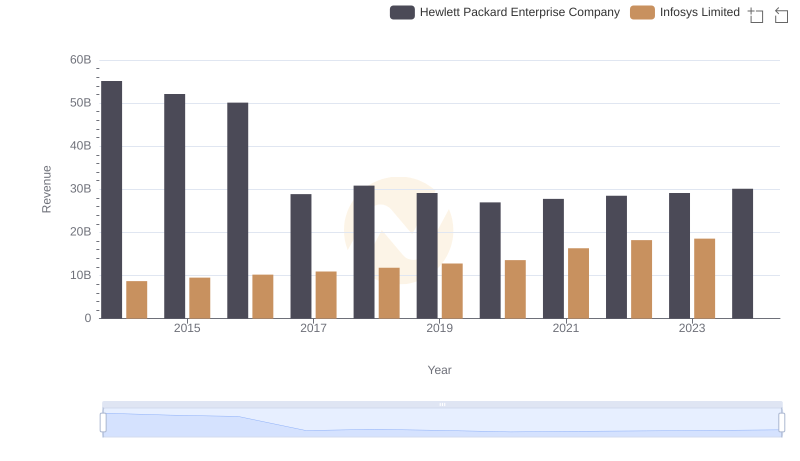
Comparing Revenue Performance: Infosys Limited or Hewlett Packard Enterprise Company?
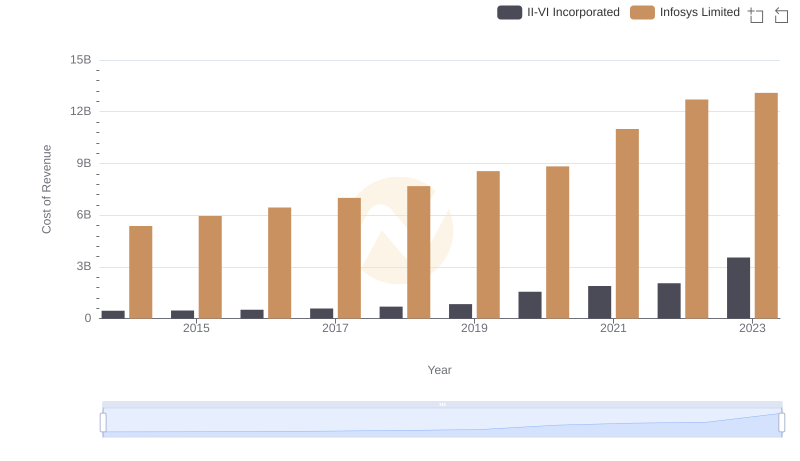
Analyzing Cost of Revenue: Infosys Limited and II-VI Incorporated
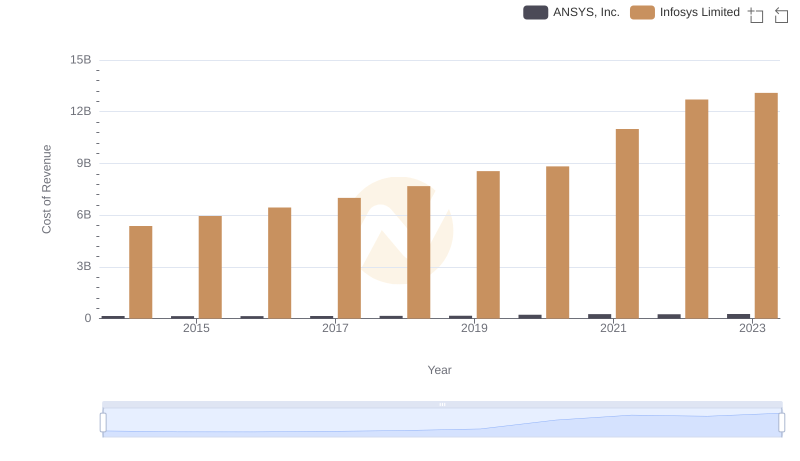
Cost of Revenue Trends: Infosys Limited vs ANSYS, Inc.
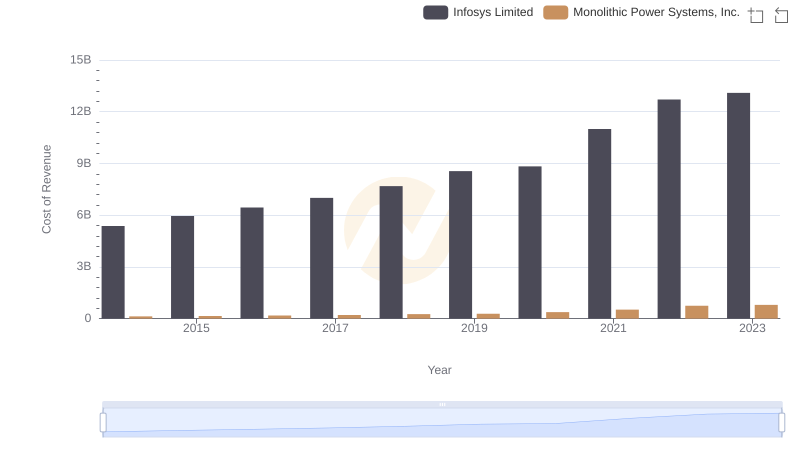
Analyzing Cost of Revenue: Infosys Limited and Monolithic Power Systems, Inc.
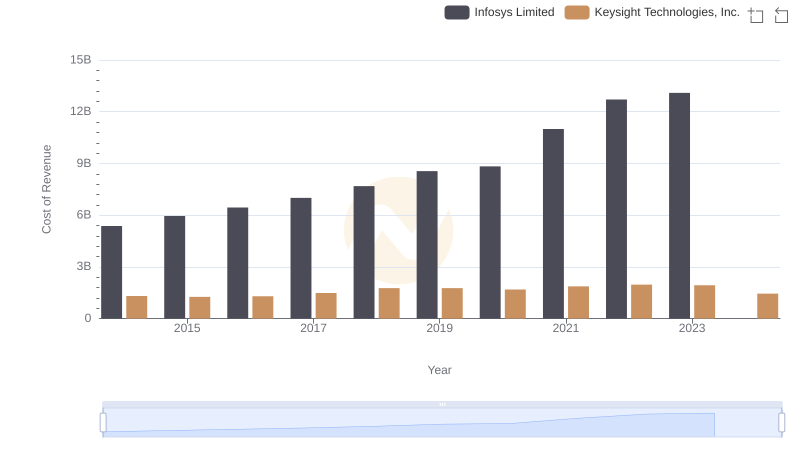
Cost Insights: Breaking Down Infosys Limited and Keysight Technologies, Inc.'s Expenses
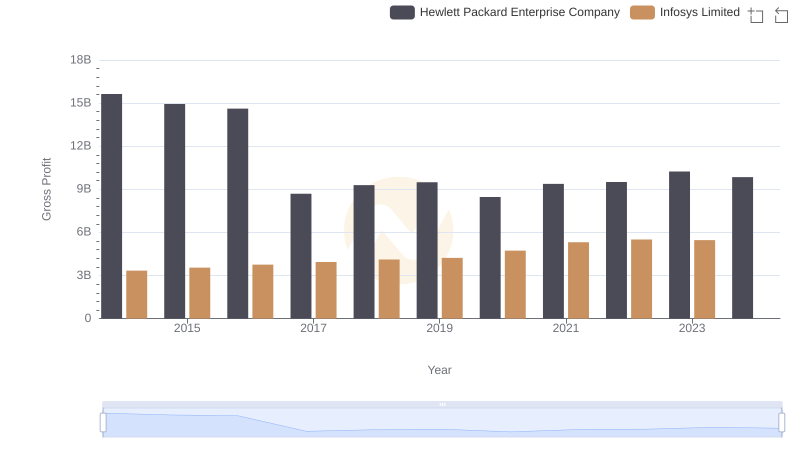
Gross Profit Trends Compared: Infosys Limited vs Hewlett Packard Enterprise Company
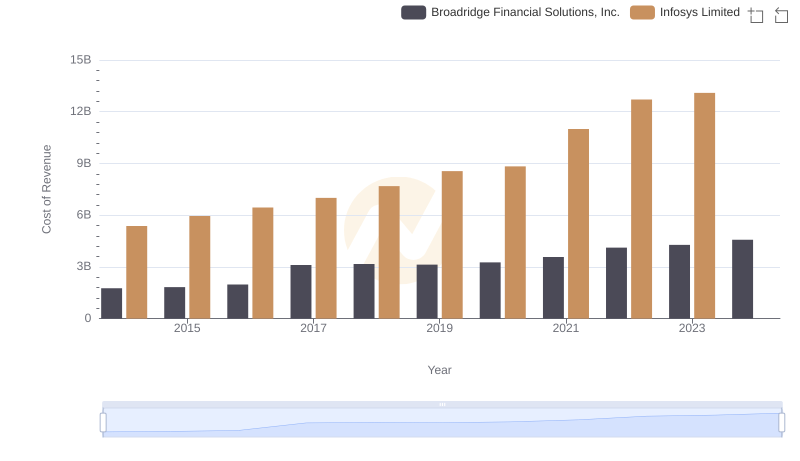
Comparing Cost of Revenue Efficiency: Infosys Limited vs Broadridge Financial Solutions, Inc.
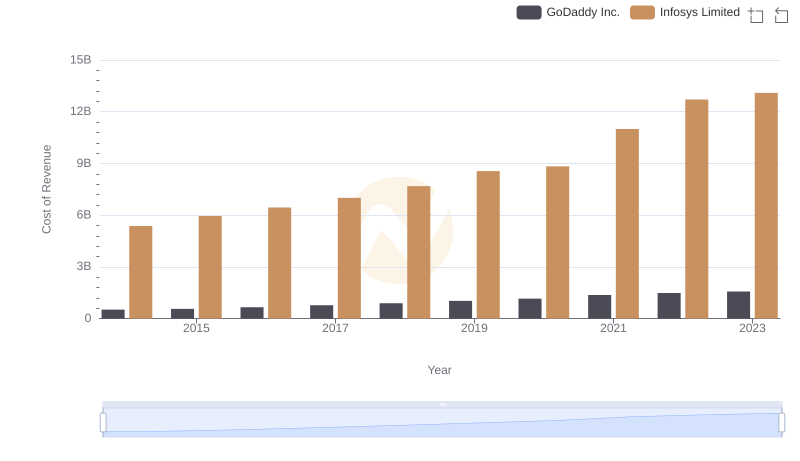
Cost of Revenue: Key Insights for Infosys Limited and GoDaddy Inc.
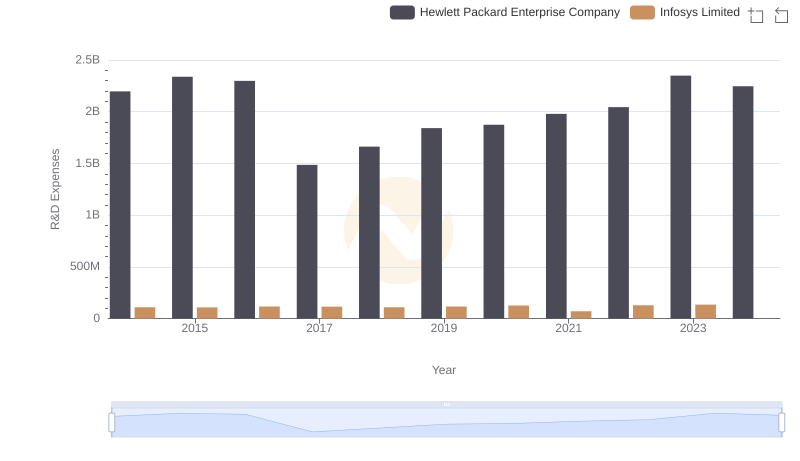
Infosys Limited vs Hewlett Packard Enterprise Company: Strategic Focus on R&D Spending
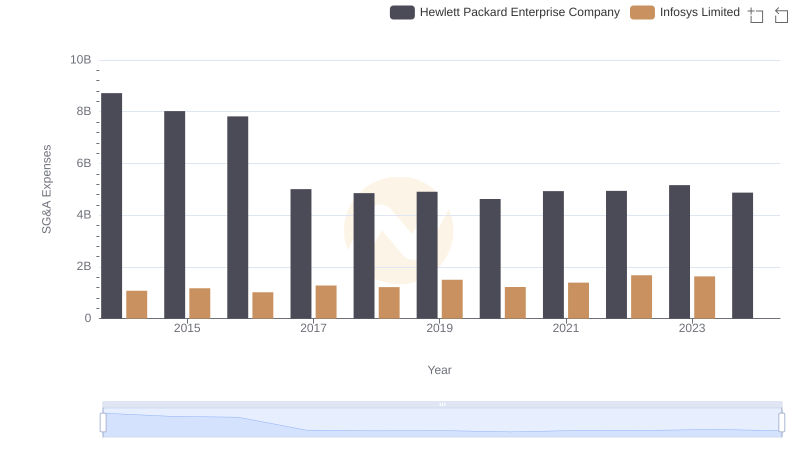
Who Optimizes SG&A Costs Better? Infosys Limited or Hewlett Packard Enterprise Company
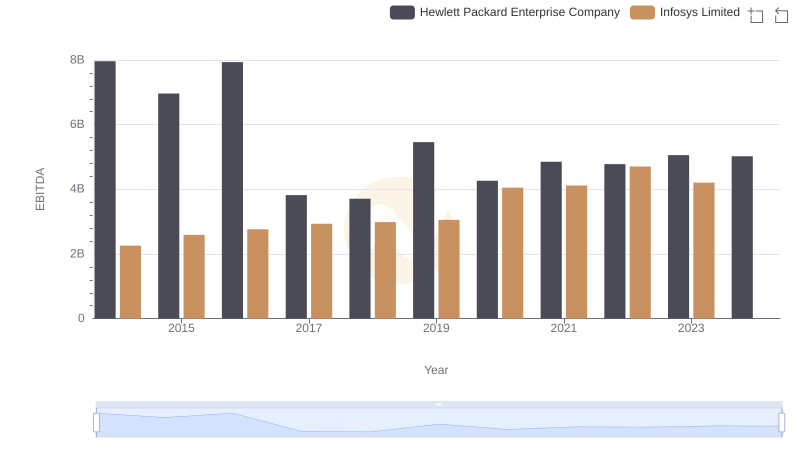
EBITDA Performance Review: Infosys Limited vs Hewlett Packard Enterprise Company