| __timestamp | Hewlett Packard Enterprise Company | Infosys Limited |
|---|---|---|
| Wednesday, January 1, 2014 | 15637000000 | 3337000000 |
| Thursday, January 1, 2015 | 14939000000 | 3551000000 |
| Friday, January 1, 2016 | 14616000000 | 3762000000 |
| Sunday, January 1, 2017 | 8694000000 | 3938000000 |
| Monday, January 1, 2018 | 9292000000 | 4112000000 |
| Tuesday, January 1, 2019 | 9493000000 | 4228000000 |
| Wednesday, January 1, 2020 | 8469000000 | 4733000000 |
| Friday, January 1, 2021 | 9376000000 | 5315000000 |
| Saturday, January 1, 2022 | 9506000000 | 5503000000 |
| Sunday, January 1, 2023 | 10239000000 | 5466000000 |
| Monday, January 1, 2024 | 9844000000 |
Unleashing insights
In the ever-evolving landscape of technology, the financial performance of industry leaders offers a window into broader market trends. From 2014 to 2023, Hewlett Packard Enterprise Company (HPE) and Infosys Limited have showcased distinct trajectories in their gross profit margins. HPE, with its roots in enterprise solutions, saw a notable decline of approximately 35% from its peak in 2014 to 2017, before stabilizing around 2020. Meanwhile, Infosys, a stalwart in IT services, demonstrated a steady growth of nearly 64% over the same period, reflecting its robust business model and expanding global footprint. The data for 2024 remains incomplete, highlighting the dynamic nature of financial forecasting. As these companies navigate the challenges of digital transformation, their financial health remains a testament to their strategic adaptability and market resilience.
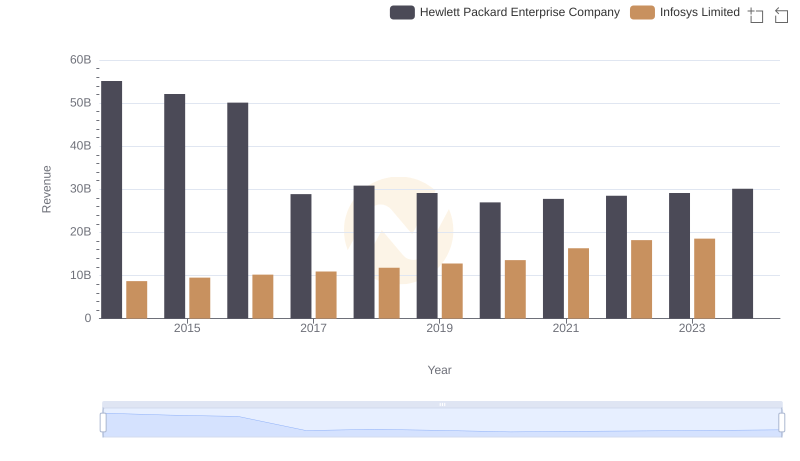
Comparing Revenue Performance: Infosys Limited or Hewlett Packard Enterprise Company?
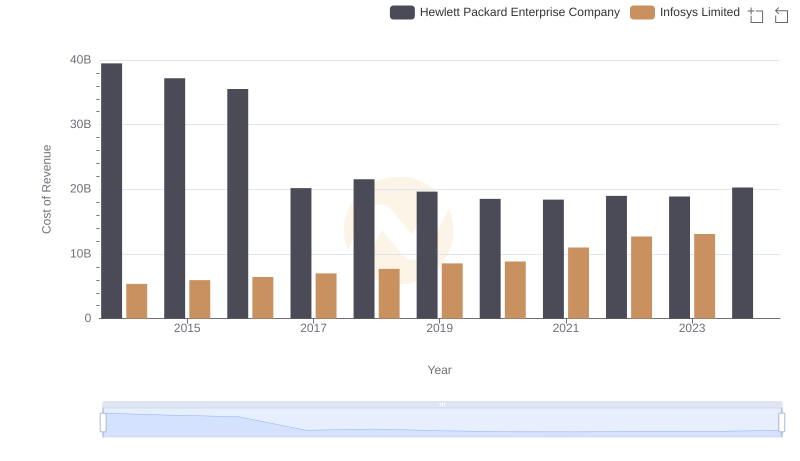
Cost of Revenue Comparison: Infosys Limited vs Hewlett Packard Enterprise Company
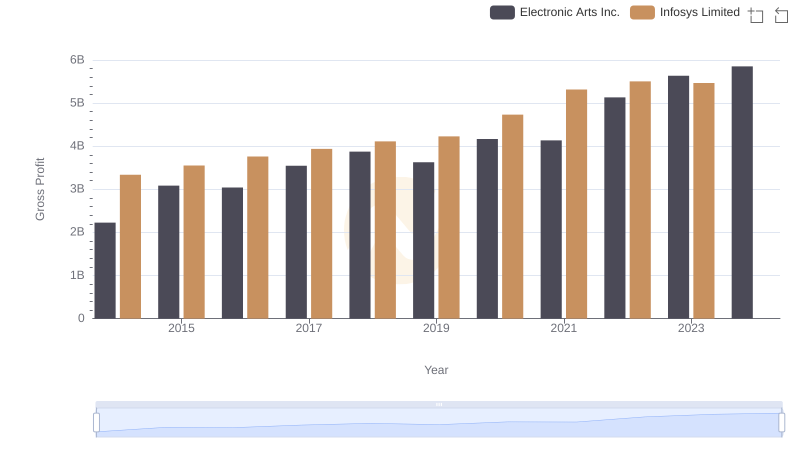
Who Generates Higher Gross Profit? Infosys Limited or Electronic Arts Inc.
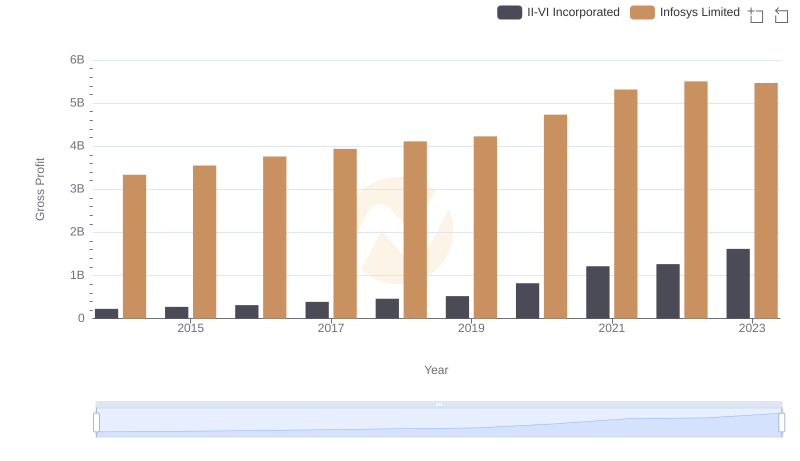
Key Insights on Gross Profit: Infosys Limited vs II-VI Incorporated
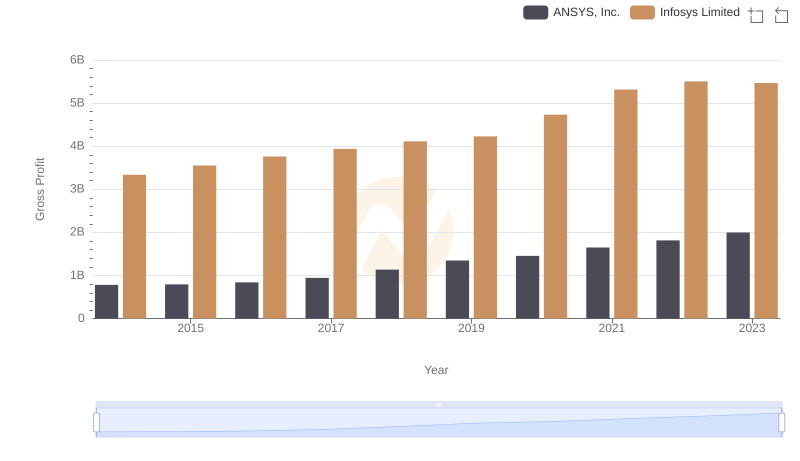
Key Insights on Gross Profit: Infosys Limited vs ANSYS, Inc.
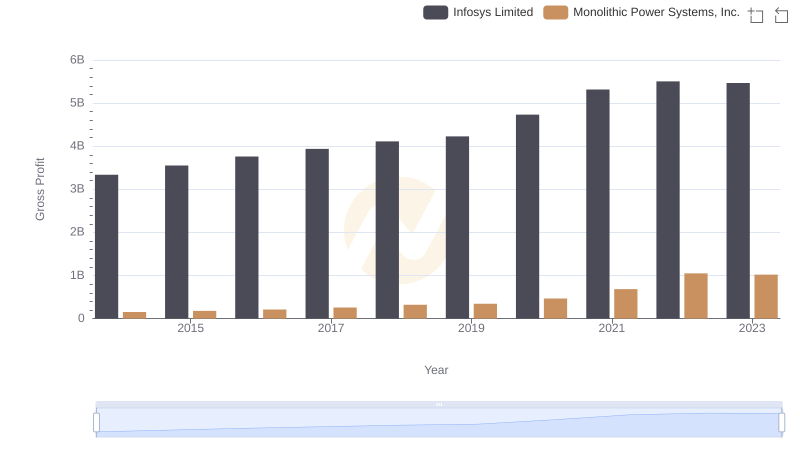
Infosys Limited and Monolithic Power Systems, Inc.: A Detailed Gross Profit Analysis
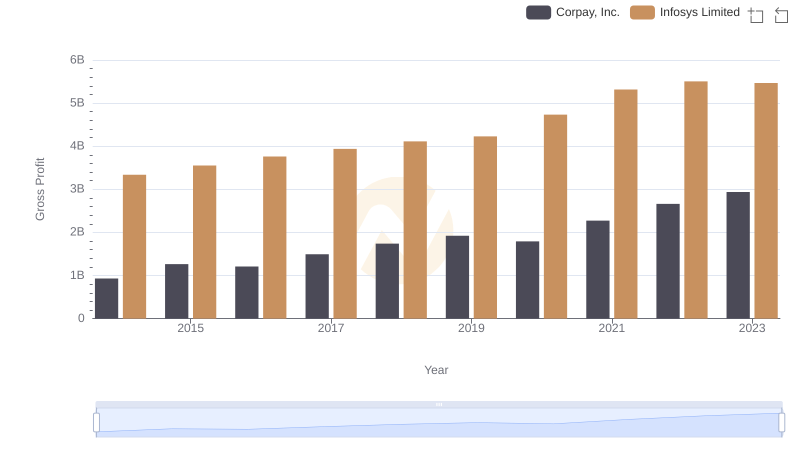
Gross Profit Analysis: Comparing Infosys Limited and Corpay, Inc.
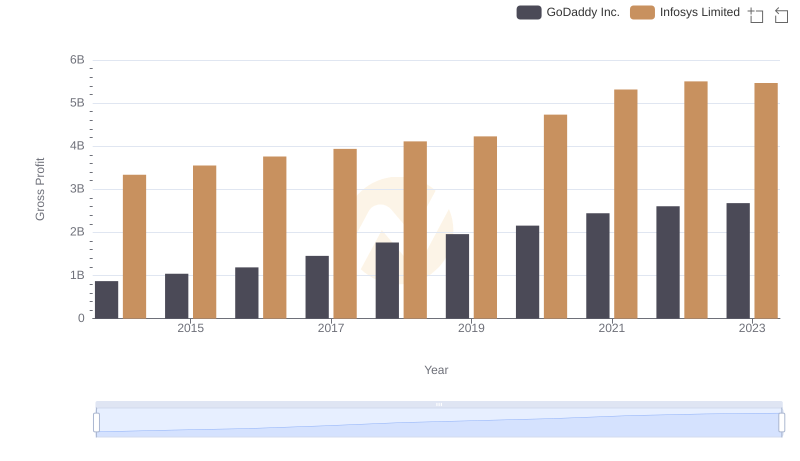
Gross Profit Trends Compared: Infosys Limited vs GoDaddy Inc.
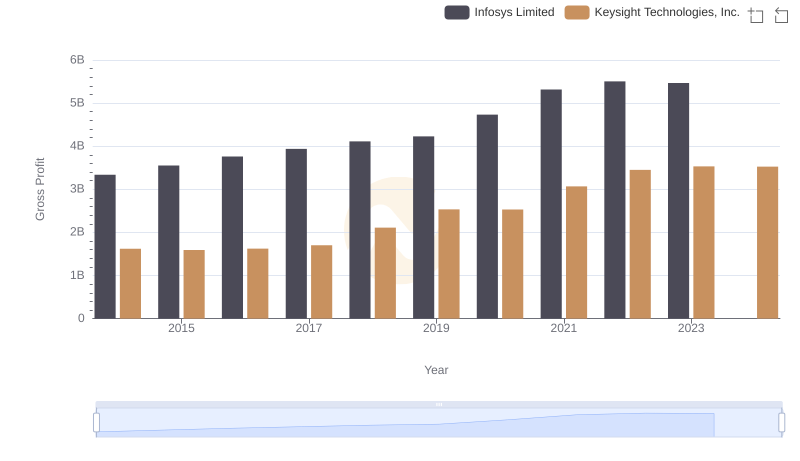
Gross Profit Comparison: Infosys Limited and Keysight Technologies, Inc. Trends
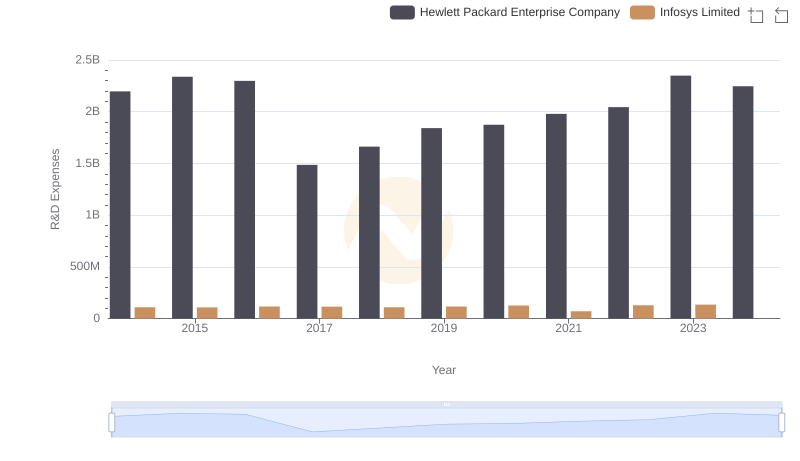
Infosys Limited vs Hewlett Packard Enterprise Company: Strategic Focus on R&D Spending
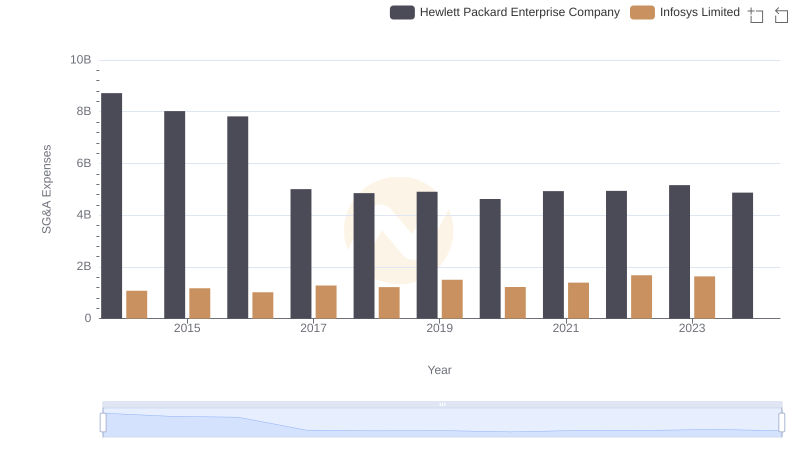
Who Optimizes SG&A Costs Better? Infosys Limited or Hewlett Packard Enterprise Company
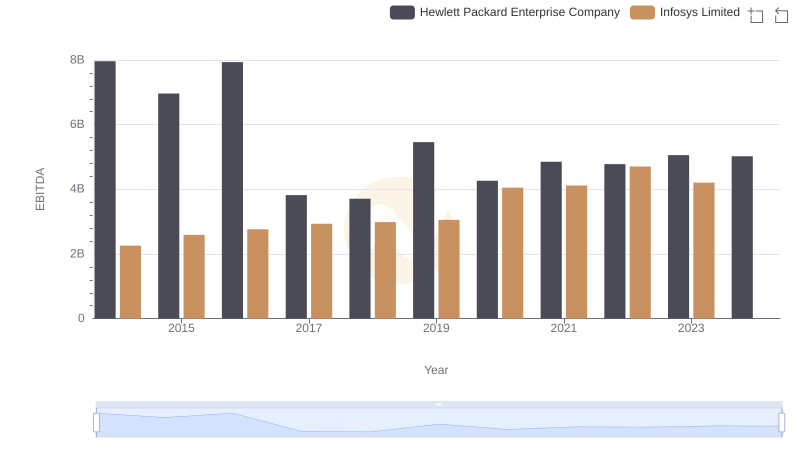
EBITDA Performance Review: Infosys Limited vs Hewlett Packard Enterprise Company