| __timestamp | United Rentals, Inc. | Waste Management, Inc. |
|---|---|---|
| Wednesday, January 1, 2014 | 1678000000 | 3509000000 |
| Thursday, January 1, 2015 | 2653000000 | 3342000000 |
| Friday, January 1, 2016 | 2566000000 | 3713000000 |
| Sunday, January 1, 2017 | 2843000000 | 3996000000 |
| Monday, January 1, 2018 | 3628000000 | 4212000000 |
| Tuesday, January 1, 2019 | 4200000000 | 4344000000 |
| Wednesday, January 1, 2020 | 2195000000 | 4149000000 |
| Friday, January 1, 2021 | 2642000000 | 4956000000 |
| Saturday, January 1, 2022 | 5464000000 | 5466000000 |
| Sunday, January 1, 2023 | 6627000000 | 5592000000 |
| Monday, January 1, 2024 | 4516000000 | 5128000000 |
In pursuit of knowledge
In the ever-evolving landscape of American industry, Waste Management, Inc. and United Rentals, Inc. have emerged as titans in their respective fields. Over the past decade, these companies have demonstrated remarkable growth in EBITDA, a key indicator of financial health. From 2014 to 2023, United Rentals saw its EBITDA soar by nearly 295%, peaking in 2023. Waste Management, on the other hand, experienced a steady climb, with a notable 59% increase over the same period, reaching its zenith in 2022.
The data reveals a fascinating narrative of resilience and strategic growth, with United Rentals showing a particularly aggressive expansion strategy. However, the absence of data for Waste Management in 2024 leaves room for speculation about its future trajectory. As these industry leaders continue to navigate economic challenges, their financial performance offers valuable insights into the broader market dynamics.
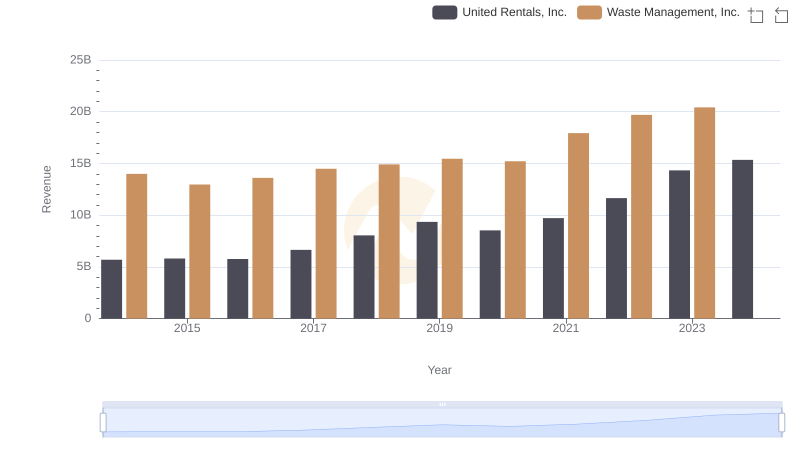
Annual Revenue Comparison: Waste Management, Inc. vs United Rentals, Inc.
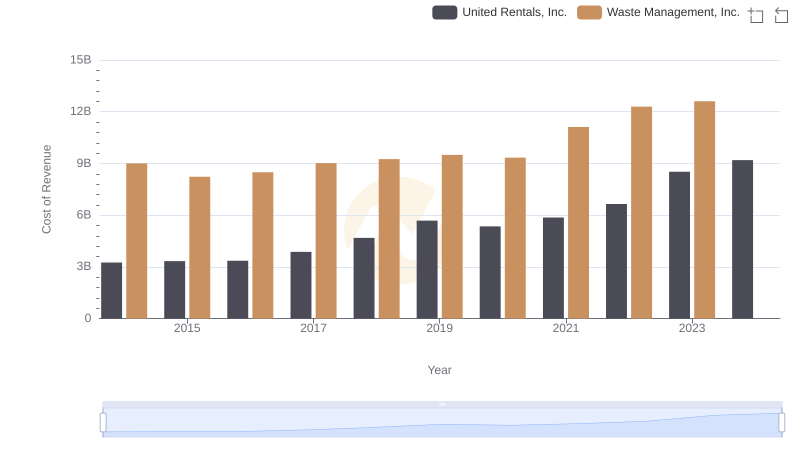
Analyzing Cost of Revenue: Waste Management, Inc. and United Rentals, Inc.
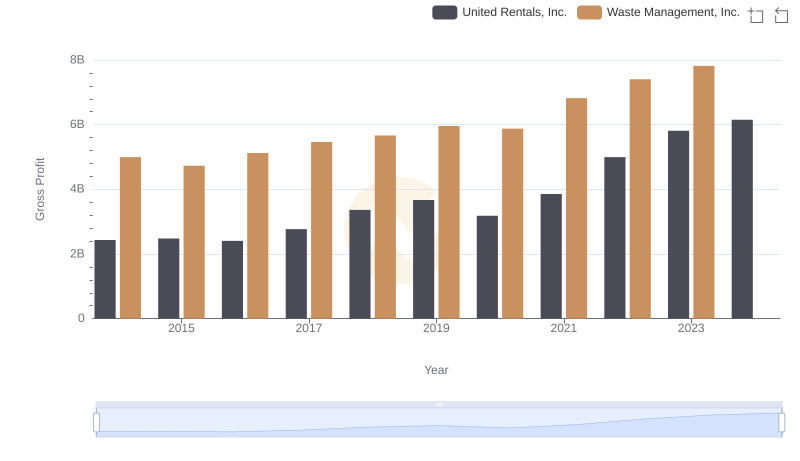
Who Generates Higher Gross Profit? Waste Management, Inc. or United Rentals, Inc.
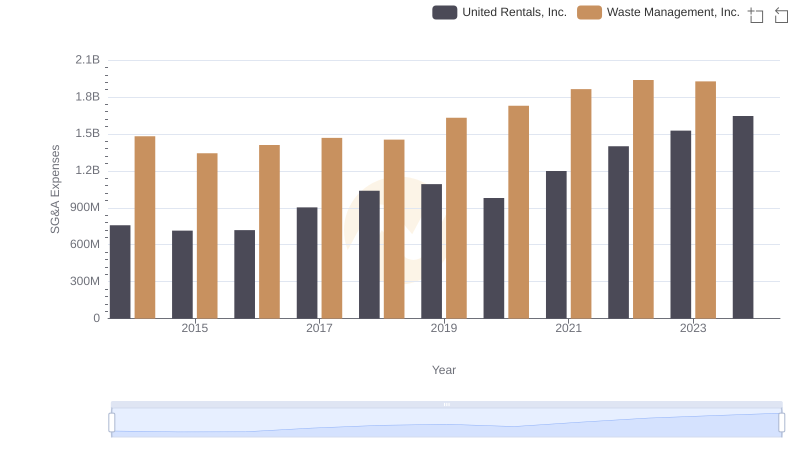
Selling, General, and Administrative Costs: Waste Management, Inc. vs United Rentals, Inc.
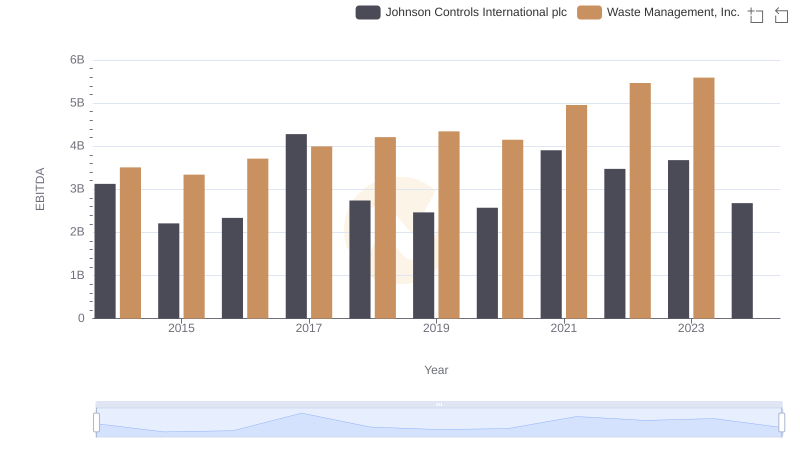
EBITDA Metrics Evaluated: Waste Management, Inc. vs Johnson Controls International plc
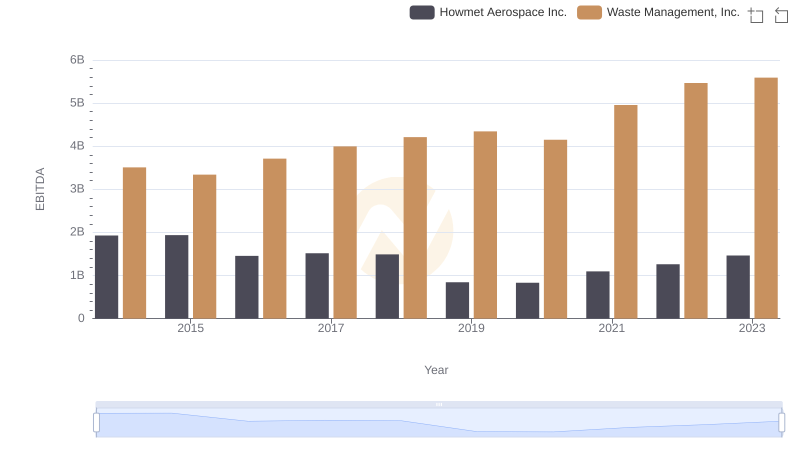
A Side-by-Side Analysis of EBITDA: Waste Management, Inc. and Howmet Aerospace Inc.
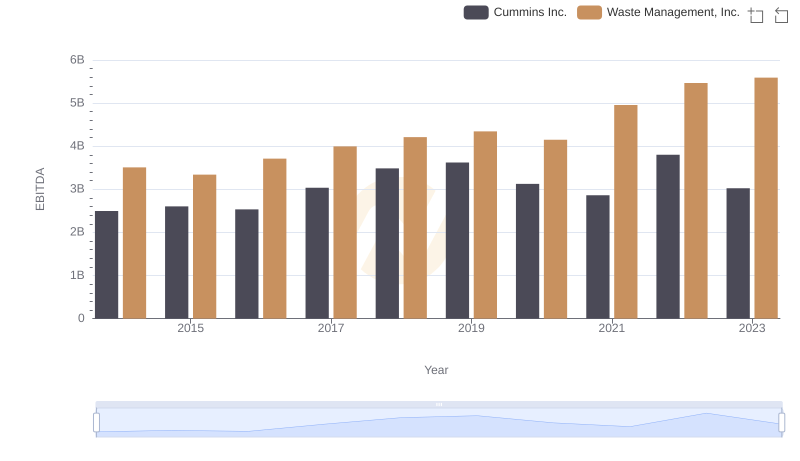
EBITDA Metrics Evaluated: Waste Management, Inc. vs Cummins Inc.
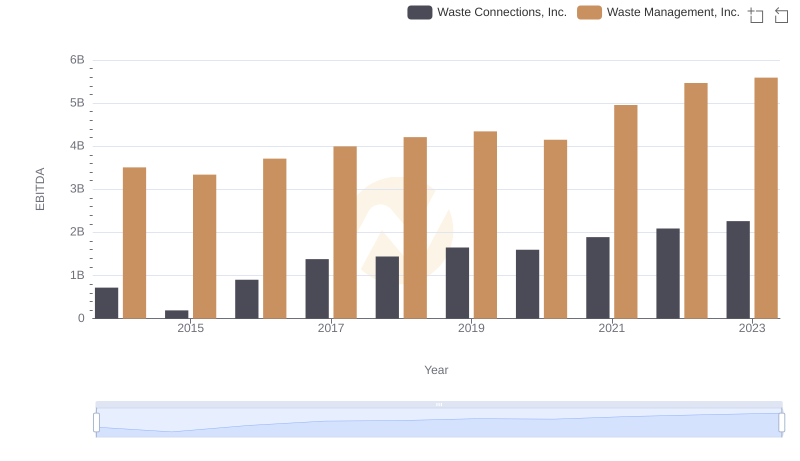
A Side-by-Side Analysis of EBITDA: Waste Management, Inc. and Waste Connections, Inc.
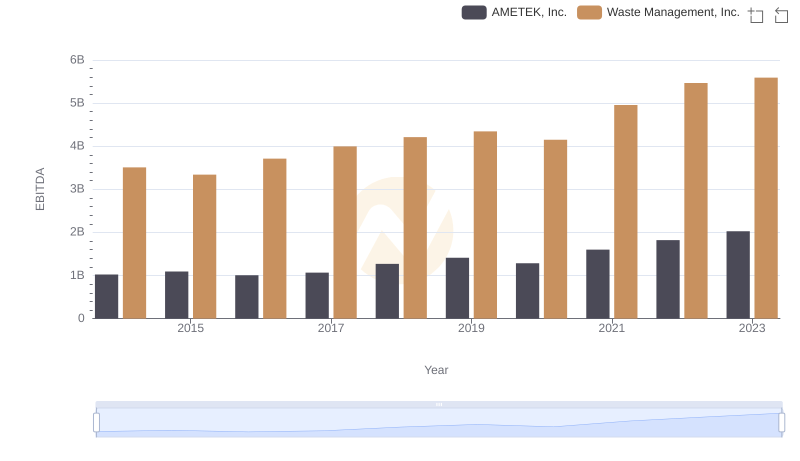
Comprehensive EBITDA Comparison: Waste Management, Inc. vs AMETEK, Inc.
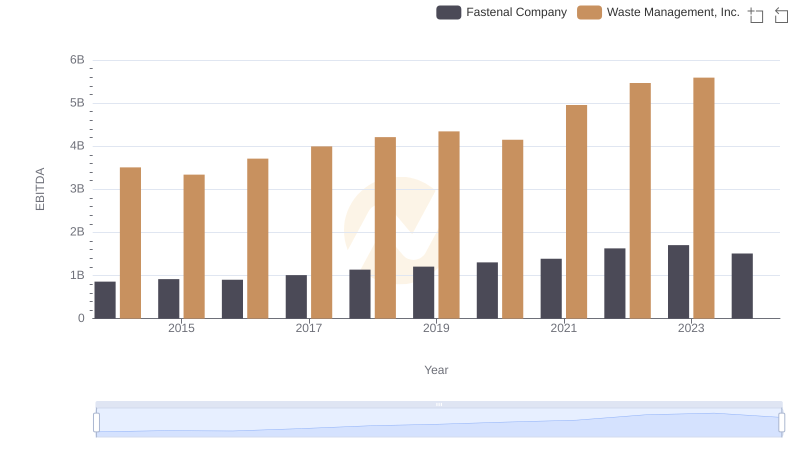
EBITDA Analysis: Evaluating Waste Management, Inc. Against Fastenal Company
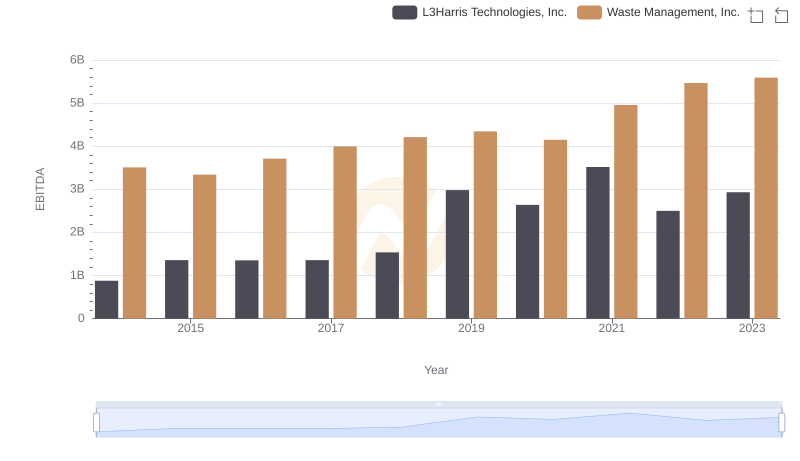
Waste Management, Inc. and L3Harris Technologies, Inc.: A Detailed Examination of EBITDA Performance