| __timestamp | Cummins Inc. | Waste Management, Inc. |
|---|---|---|
| Wednesday, January 1, 2014 | 19221000000 | 13996000000 |
| Thursday, January 1, 2015 | 19110000000 | 12961000000 |
| Friday, January 1, 2016 | 17509000000 | 13609000000 |
| Sunday, January 1, 2017 | 20428000000 | 14485000000 |
| Monday, January 1, 2018 | 23771000000 | 14914000000 |
| Tuesday, January 1, 2019 | 23571000000 | 15455000000 |
| Wednesday, January 1, 2020 | 19811000000 | 15218000000 |
| Friday, January 1, 2021 | 24021000000 | 17931000000 |
| Saturday, January 1, 2022 | 28074000000 | 19698000000 |
| Sunday, January 1, 2023 | 34065000000 | 20426000000 |
| Monday, January 1, 2024 | 34102000000 | 22063000000 |
Cracking the code
In the ever-evolving landscape of American industry, Waste Management, Inc. and Cummins Inc. have emerged as titans in their respective fields. Over the past decade, from 2014 to 2023, these companies have demonstrated remarkable resilience and growth. Cummins Inc., a leader in power solutions, saw its revenue soar by approximately 77%, reaching a peak in 2023. Meanwhile, Waste Management, Inc., a stalwart in environmental services, experienced a steady revenue increase of around 46% over the same period.
The data reveals a fascinating trend: while Cummins Inc. experienced a dip in 2016, it rebounded strongly, showcasing its adaptability in a competitive market. Waste Management, Inc. maintained a consistent upward trajectory, reflecting its robust business model. This comparison not only highlights the dynamic nature of these industries but also underscores the importance of strategic growth and innovation.
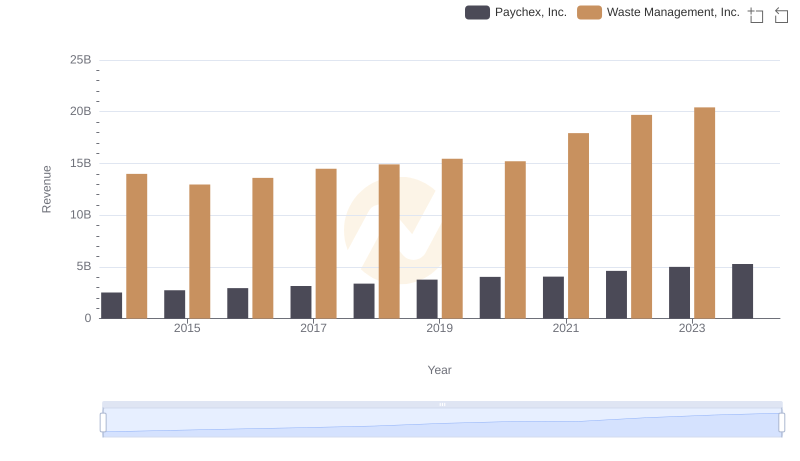
Comparing Revenue Performance: Waste Management, Inc. or Paychex, Inc.?

Comparing Revenue Performance: Waste Management, Inc. or Johnson Controls International plc?
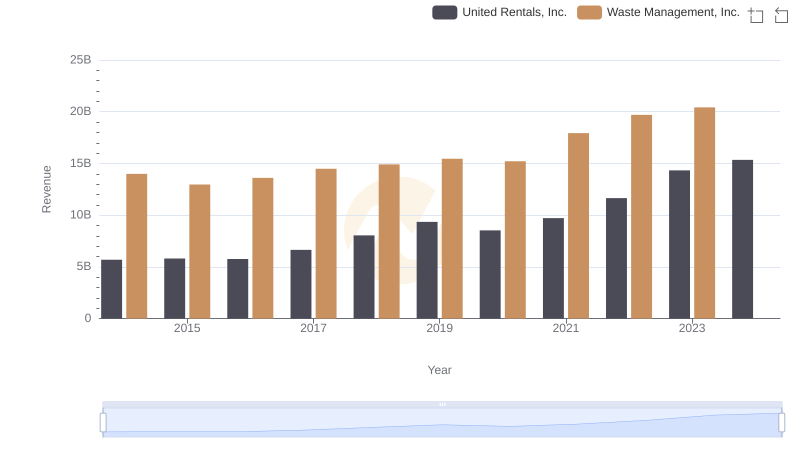
Annual Revenue Comparison: Waste Management, Inc. vs United Rentals, Inc.
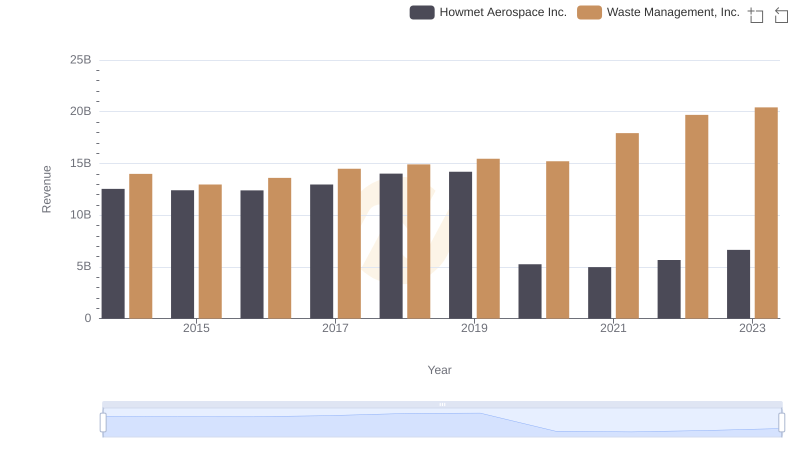
Waste Management, Inc. or Howmet Aerospace Inc.: Who Leads in Yearly Revenue?
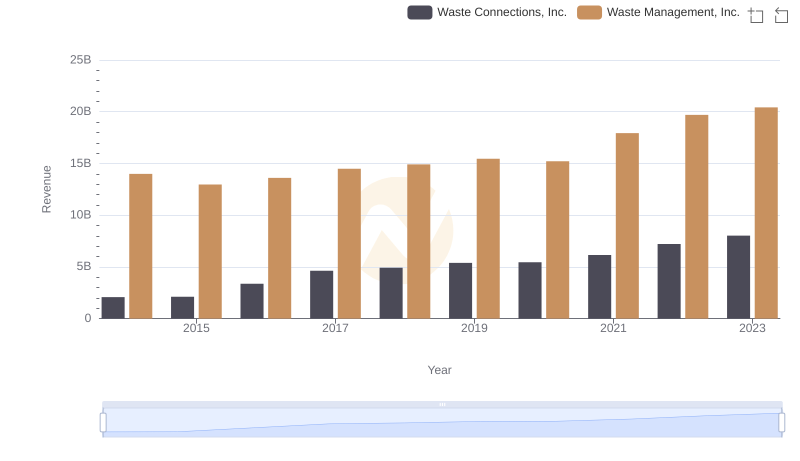
Who Generates More Revenue? Waste Management, Inc. or Waste Connections, Inc.
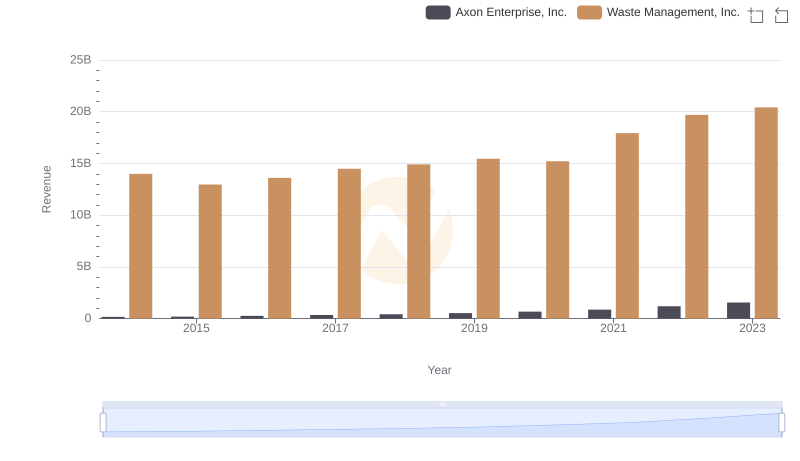
Waste Management, Inc. or Axon Enterprise, Inc.: Who Leads in Yearly Revenue?

Breaking Down Revenue Trends: Waste Management, Inc. vs Delta Air Lines, Inc.
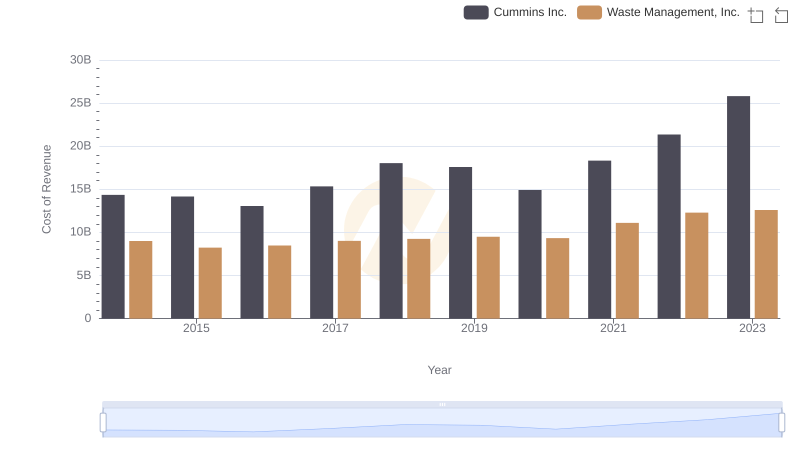
Waste Management, Inc. vs Cummins Inc.: Efficiency in Cost of Revenue Explored
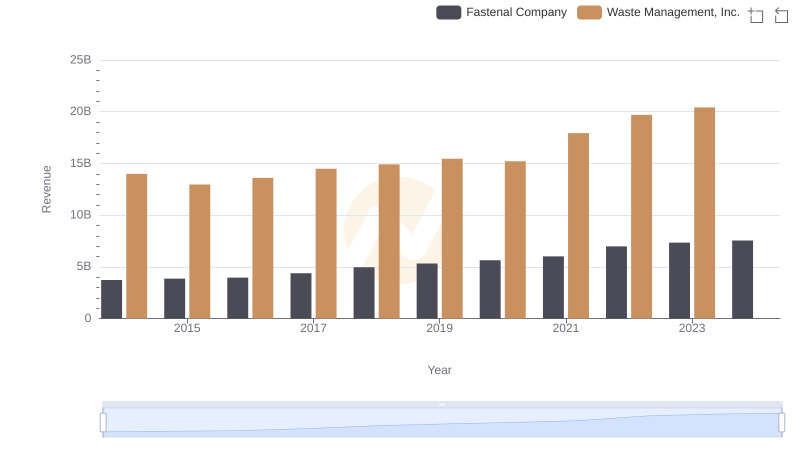
Waste Management, Inc. vs Fastenal Company: Examining Key Revenue Metrics
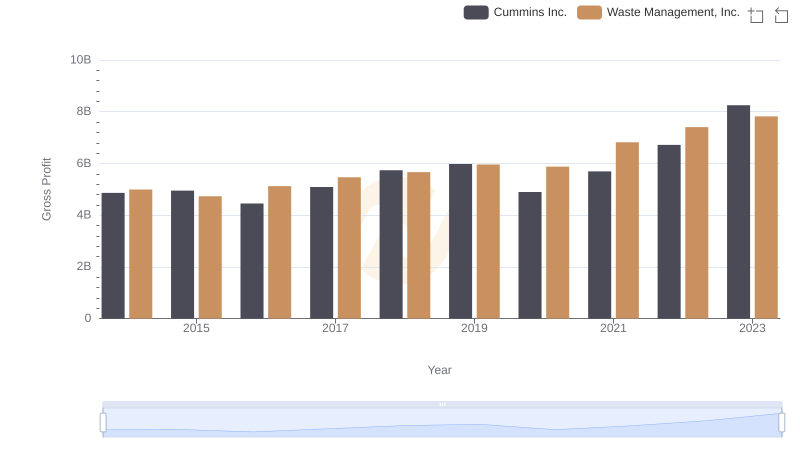
Who Generates Higher Gross Profit? Waste Management, Inc. or Cummins Inc.
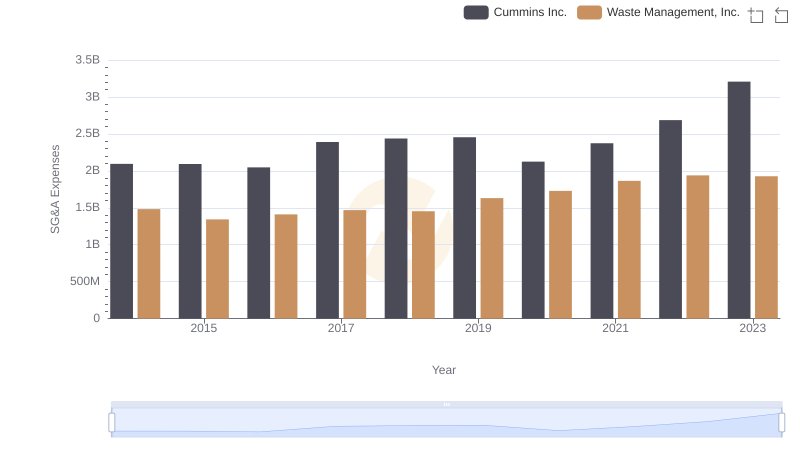
Breaking Down SG&A Expenses: Waste Management, Inc. vs Cummins Inc.
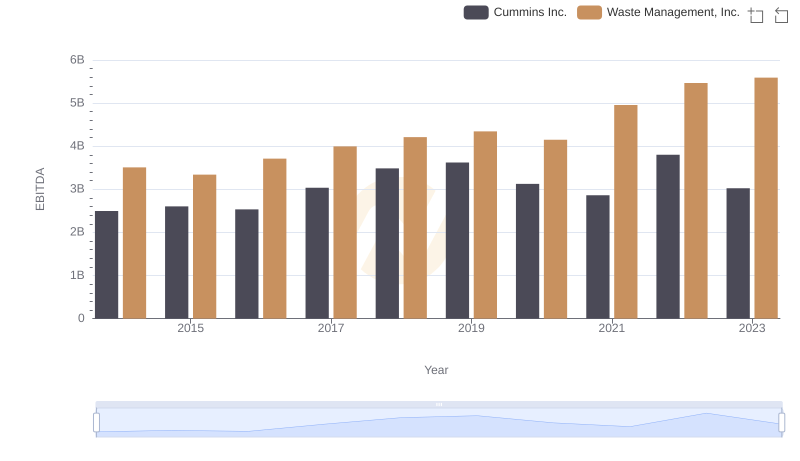
EBITDA Metrics Evaluated: Waste Management, Inc. vs Cummins Inc.