| __timestamp | Cummins Inc. | Waste Management, Inc. |
|---|---|---|
| Wednesday, January 1, 2014 | 2095000000 | 1481000000 |
| Thursday, January 1, 2015 | 2092000000 | 1343000000 |
| Friday, January 1, 2016 | 2046000000 | 1410000000 |
| Sunday, January 1, 2017 | 2390000000 | 1468000000 |
| Monday, January 1, 2018 | 2437000000 | 1453000000 |
| Tuesday, January 1, 2019 | 2454000000 | 1631000000 |
| Wednesday, January 1, 2020 | 2125000000 | 1728000000 |
| Friday, January 1, 2021 | 2374000000 | 1864000000 |
| Saturday, January 1, 2022 | 2687000000 | 1938000000 |
| Sunday, January 1, 2023 | 3208000000 | 1926000000 |
| Monday, January 1, 2024 | 3275000000 | 2264000000 |
Data in motion
In the ever-evolving landscape of corporate finance, understanding the nuances of Selling, General, and Administrative (SG&A) expenses is crucial. Over the past decade, Cummins Inc. and Waste Management, Inc. have showcased distinct trajectories in their SG&A expenditures. From 2014 to 2023, Cummins Inc. experienced a notable 53% increase in SG&A expenses, peaking in 2023. In contrast, Waste Management, Inc. saw a more modest 29% rise over the same period, with a slight dip in 2023.
This divergence highlights differing strategic priorities and operational efficiencies. Cummins' substantial growth in SG&A could indicate aggressive expansion or increased investment in administrative capabilities. Meanwhile, Waste Management's steadier rise suggests a focus on cost control and efficiency. As businesses navigate the complexities of the modern economy, these insights into SG&A trends offer valuable lessons in balancing growth with fiscal responsibility.
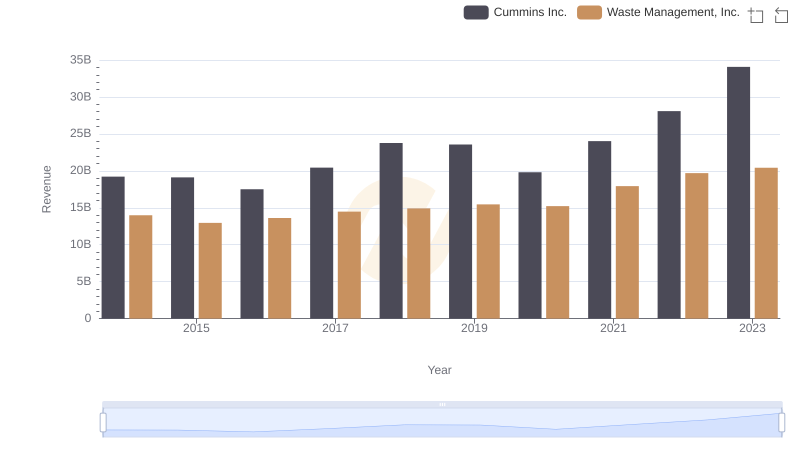
Waste Management, Inc. vs Cummins Inc.: Examining Key Revenue Metrics
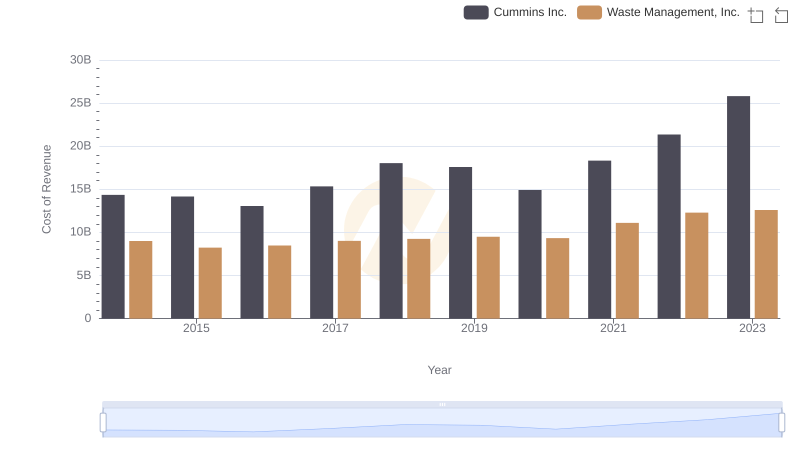
Waste Management, Inc. vs Cummins Inc.: Efficiency in Cost of Revenue Explored
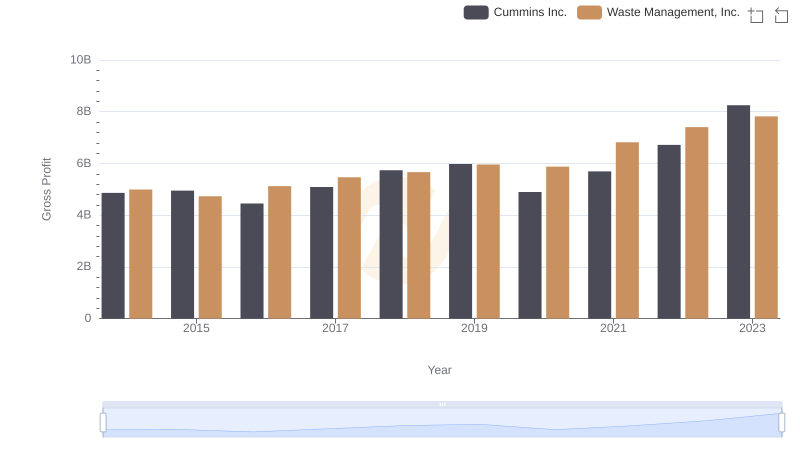
Who Generates Higher Gross Profit? Waste Management, Inc. or Cummins Inc.
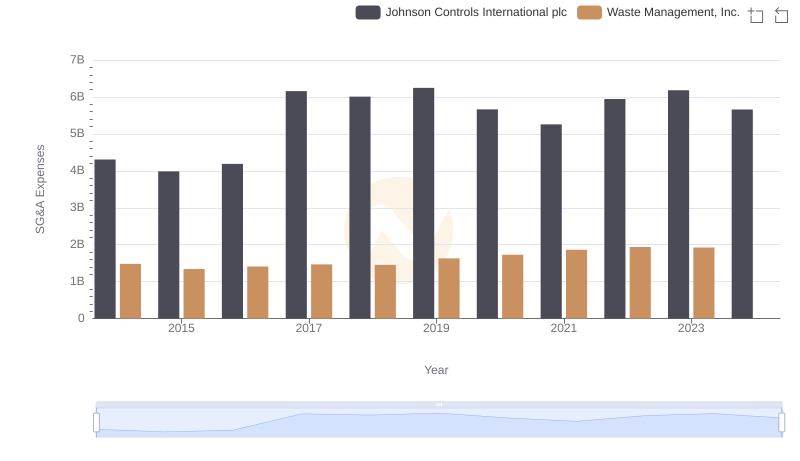
Waste Management, Inc. and Johnson Controls International plc: SG&A Spending Patterns Compared
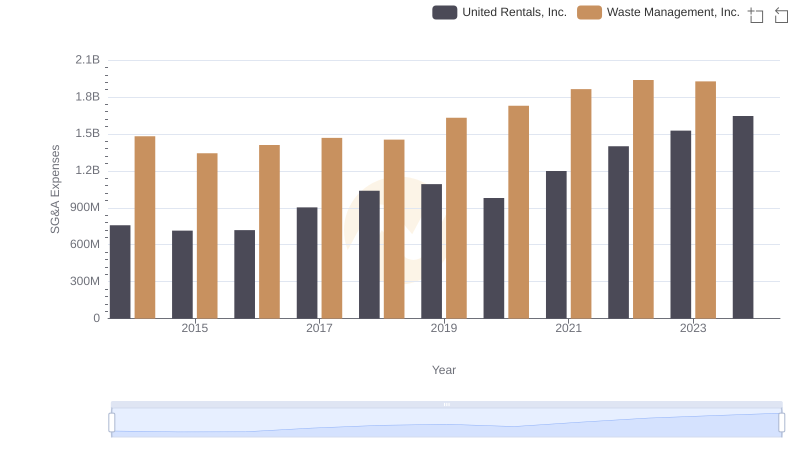
Selling, General, and Administrative Costs: Waste Management, Inc. vs United Rentals, Inc.
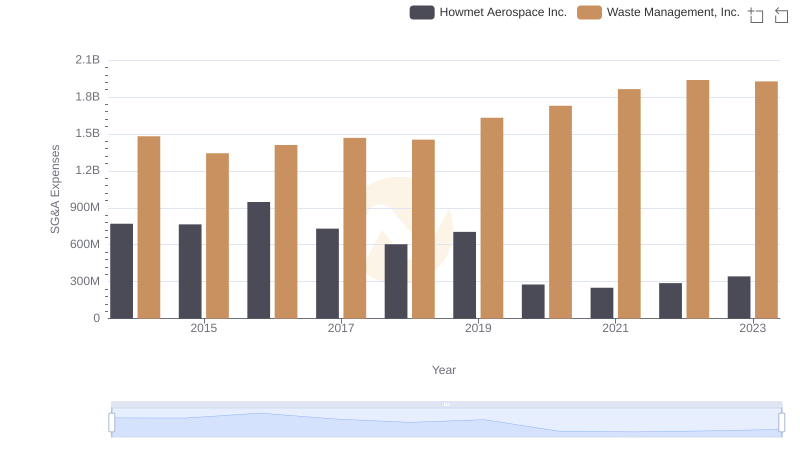
Cost Management Insights: SG&A Expenses for Waste Management, Inc. and Howmet Aerospace Inc.
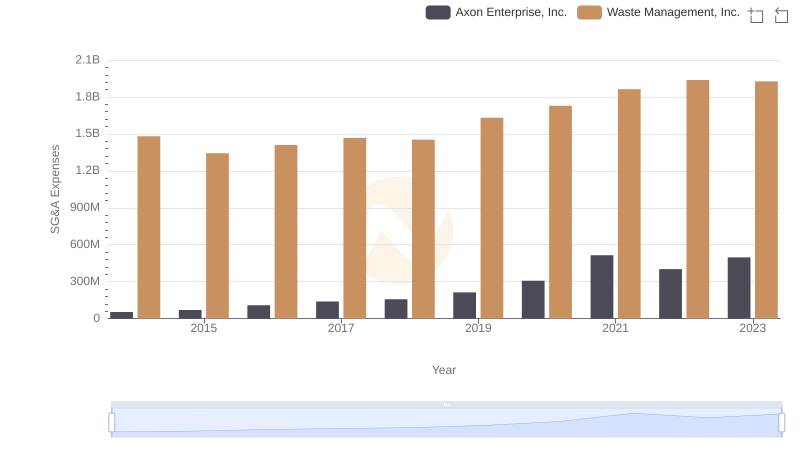
Who Optimizes SG&A Costs Better? Waste Management, Inc. or Axon Enterprise, Inc.
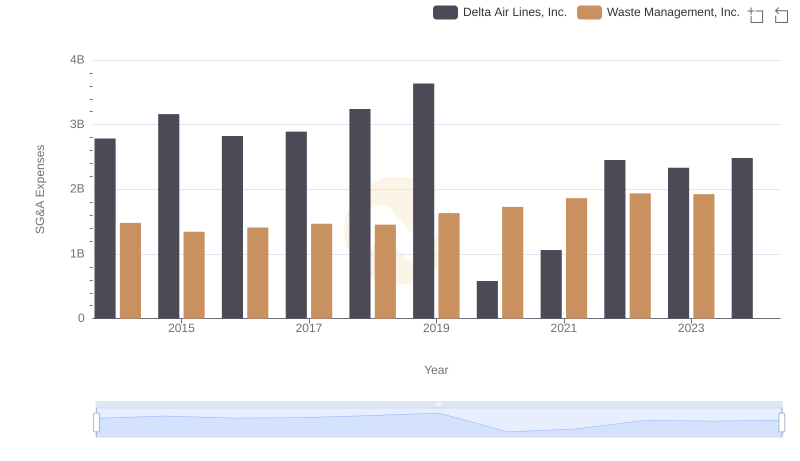
Waste Management, Inc. or Delta Air Lines, Inc.: Who Manages SG&A Costs Better?
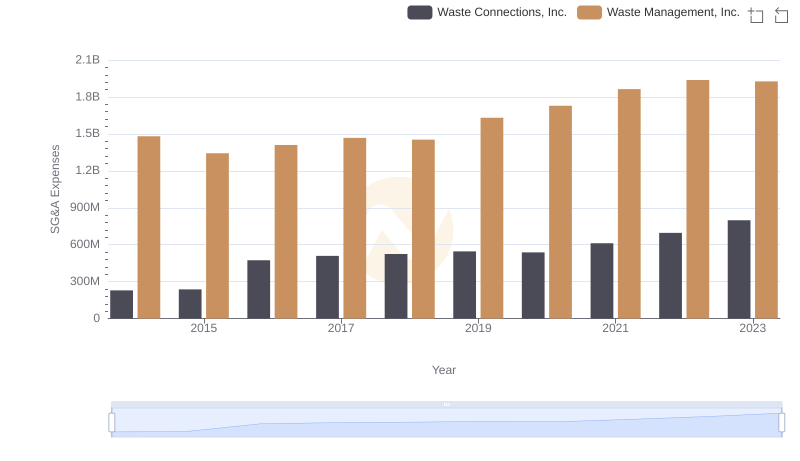
SG&A Efficiency Analysis: Comparing Waste Management, Inc. and Waste Connections, Inc.
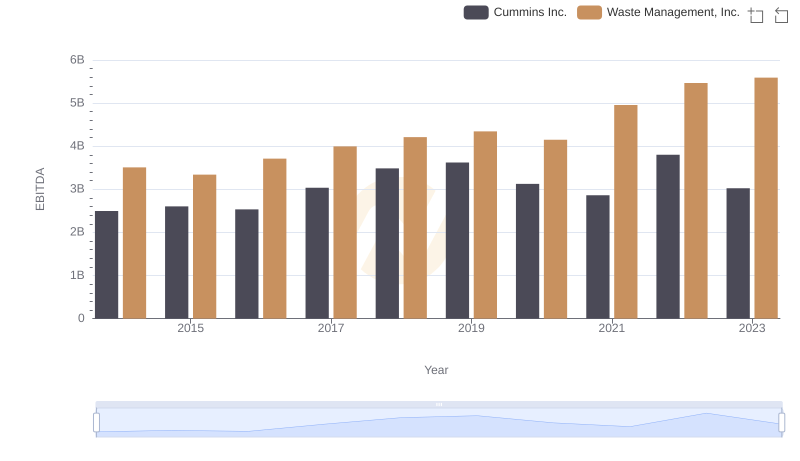
EBITDA Metrics Evaluated: Waste Management, Inc. vs Cummins Inc.
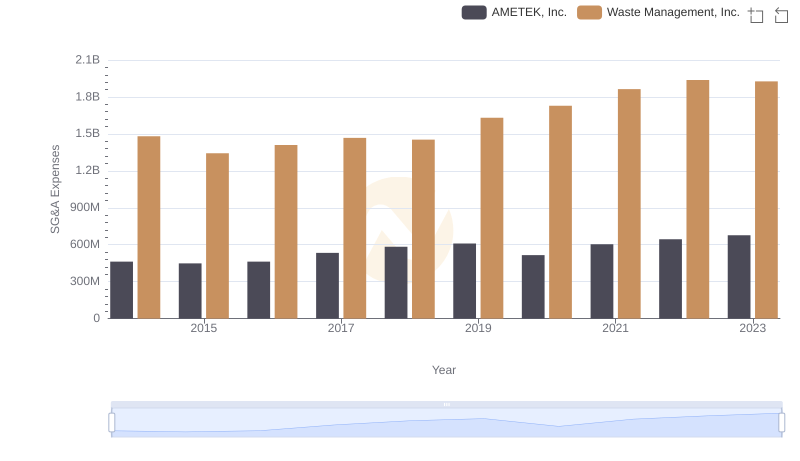
SG&A Efficiency Analysis: Comparing Waste Management, Inc. and AMETEK, Inc.
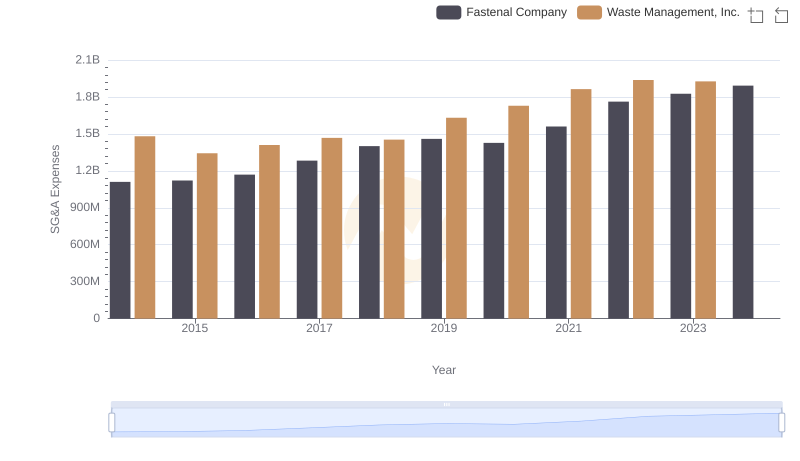
Waste Management, Inc. vs Fastenal Company: SG&A Expense Trends