| __timestamp | Owens Corning | Waste Connections, Inc. |
|---|---|---|
| Wednesday, January 1, 2014 | 5276000000 | 2079166000 |
| Thursday, January 1, 2015 | 5350000000 | 2117287000 |
| Friday, January 1, 2016 | 5677000000 | 3375863000 |
| Sunday, January 1, 2017 | 6384000000 | 4630488000 |
| Monday, January 1, 2018 | 7057000000 | 4922941000 |
| Tuesday, January 1, 2019 | 7160000000 | 5388679000 |
| Wednesday, January 1, 2020 | 7055000000 | 5445990000 |
| Friday, January 1, 2021 | 8498000000 | 6151361000 |
| Saturday, January 1, 2022 | 9761000000 | 7211859000 |
| Sunday, January 1, 2023 | 9677000000 | 8021951000 |
| Monday, January 1, 2024 | 8919591000 |
Infusing magic into the data realm
In the ever-evolving landscape of American industry, Waste Connections, Inc. and Owens Corning have emerged as key players in their respective sectors. From 2014 to 2023, Owens Corning consistently outperformed Waste Connections, Inc. in terms of revenue, with an average annual revenue of approximately $7.2 billion compared to Waste Connections, Inc.'s $4.9 billion. However, the gap has been narrowing. By 2023, Waste Connections, Inc. achieved a remarkable 286% growth from its 2014 revenue, reaching $8 billion, while Owens Corning saw a 83% increase, peaking at $9.7 billion in 2022 before slightly declining in 2023. This trend highlights Waste Connections, Inc.'s aggressive growth strategy, positioning it as a formidable competitor. As these companies continue to innovate and expand, investors and industry watchers should keep a close eye on their financial trajectories.
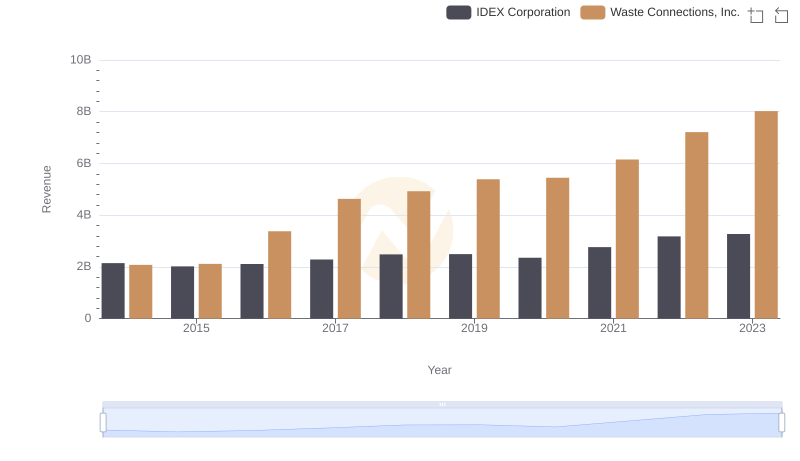
Revenue Insights: Waste Connections, Inc. and IDEX Corporation Performance Compared
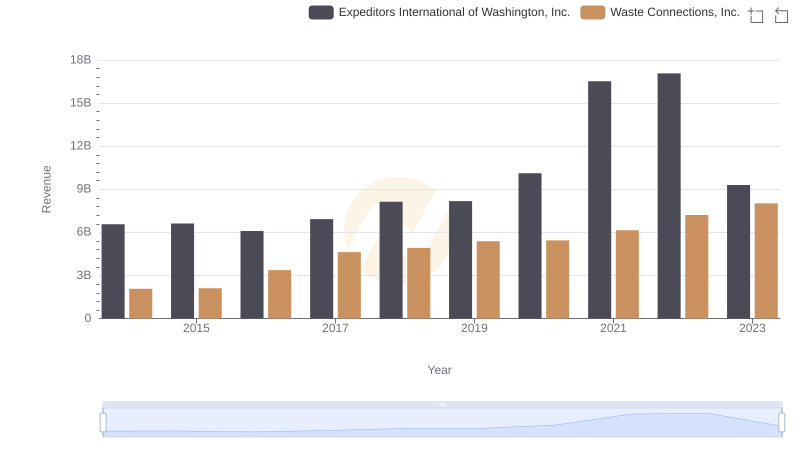
Waste Connections, Inc. or Expeditors International of Washington, Inc.: Who Leads in Yearly Revenue?
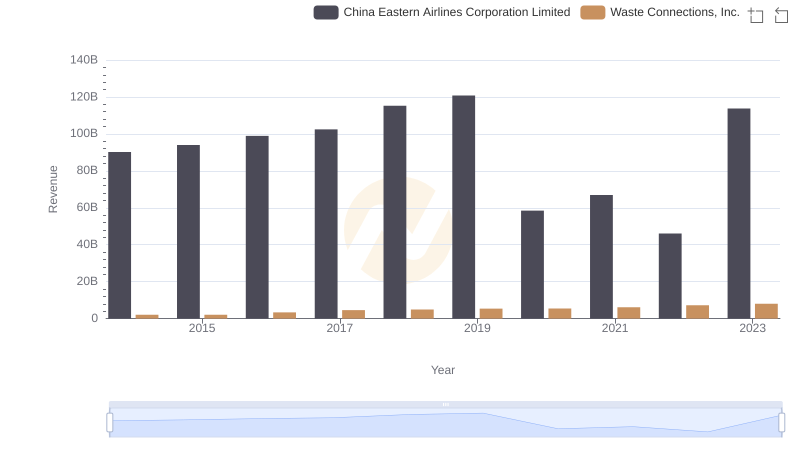
Revenue Insights: Waste Connections, Inc. and China Eastern Airlines Corporation Limited Performance Compared
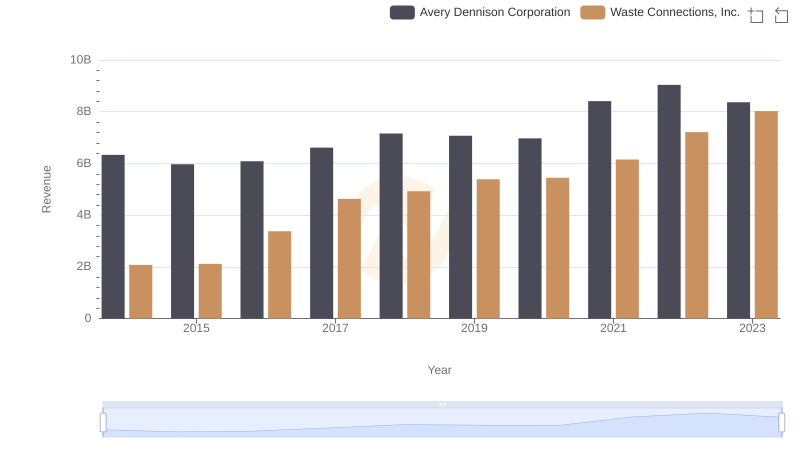
Waste Connections, Inc. vs Avery Dennison Corporation: Annual Revenue Growth Compared
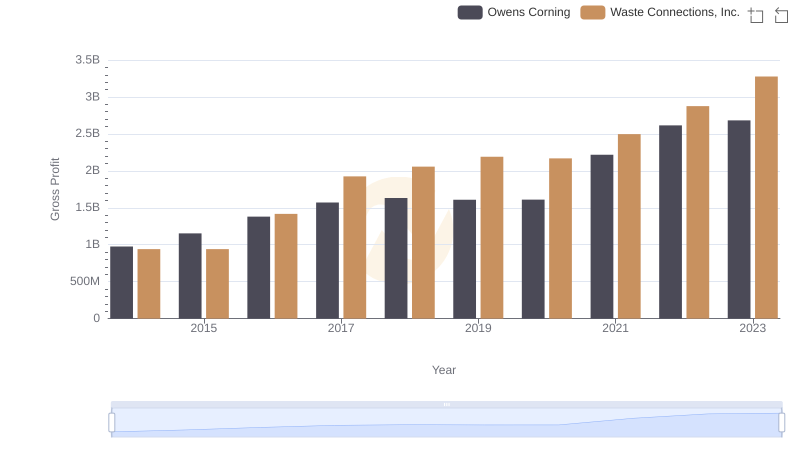
Who Generates Higher Gross Profit? Waste Connections, Inc. or Owens Corning
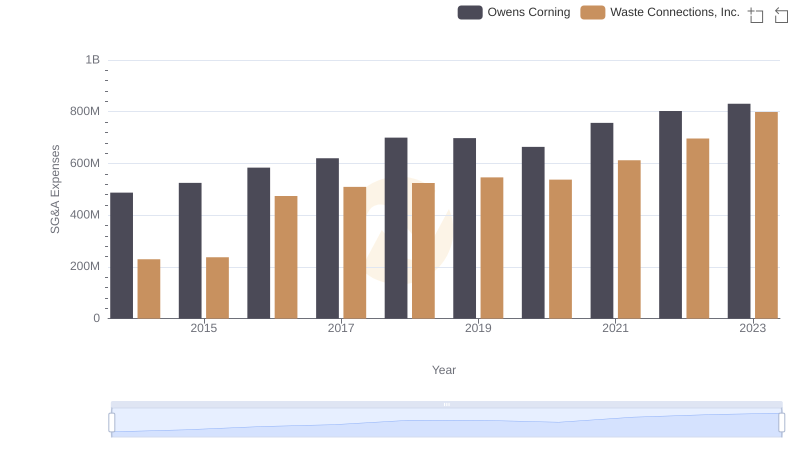
Who Optimizes SG&A Costs Better? Waste Connections, Inc. or Owens Corning
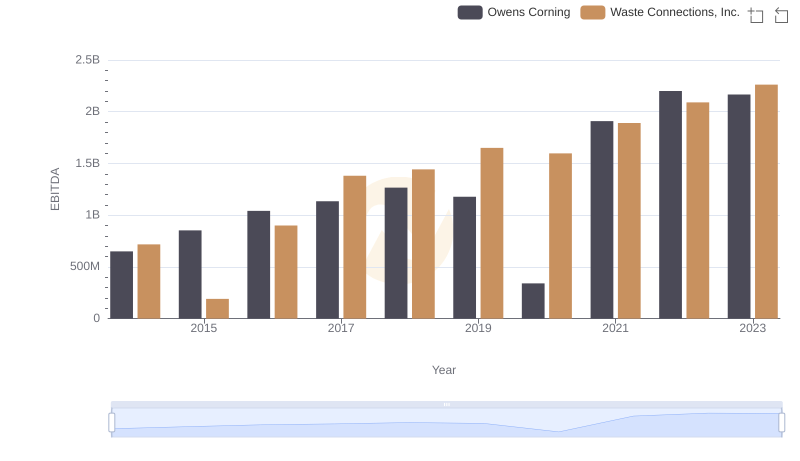
EBITDA Metrics Evaluated: Waste Connections, Inc. vs Owens Corning