| __timestamp | L3Harris Technologies, Inc. | Waste Connections, Inc. |
|---|---|---|
| Wednesday, January 1, 2014 | 1515000000 | 940778000 |
| Thursday, January 1, 2015 | 2160000000 | 939878000 |
| Friday, January 1, 2016 | 2043000000 | 1418151000 |
| Sunday, January 1, 2017 | 2102000000 | 1925713000 |
| Monday, January 1, 2018 | 2334000000 | 2057237000 |
| Tuesday, January 1, 2019 | 5074000000 | 2189922000 |
| Wednesday, January 1, 2020 | 5308000000 | 2169182000 |
| Friday, January 1, 2021 | 5376000000 | 2497287000 |
| Saturday, January 1, 2022 | 4927000000 | 2875847000 |
| Sunday, January 1, 2023 | 5113000000 | 3277438000 |
| Monday, January 1, 2024 | 5524000000 | 3727885000 |
In pursuit of knowledge
In the ever-evolving landscape of corporate finance, understanding the trajectory of gross profit is crucial for investors and analysts alike. Over the past decade, L3Harris Technologies, Inc. and Waste Connections, Inc. have demonstrated remarkable growth in their gross profits, reflecting their strategic prowess and market adaptability.
From 2014 to 2023, L3Harris Technologies, Inc. saw its gross profit soar by approximately 238%, peaking in 2021 with a staggering $5.38 billion. This growth underscores the company's robust defense and technology solutions that have consistently met market demands. Meanwhile, Waste Connections, Inc. experienced a commendable 248% increase in gross profit, reaching $3.28 billion in 2023. This growth trajectory highlights the company's effective waste management solutions and expanding market presence.
These insights not only showcase the financial health of these companies but also provide a window into their strategic directions and market resilience.
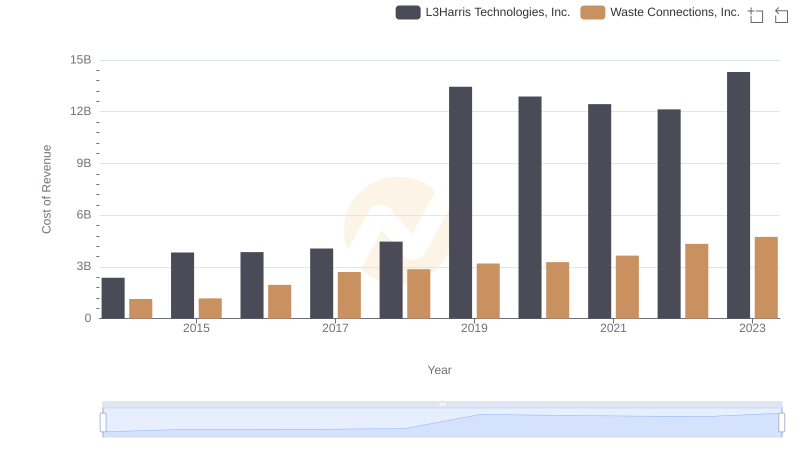
Cost of Revenue: Key Insights for Waste Connections, Inc. and L3Harris Technologies, Inc.
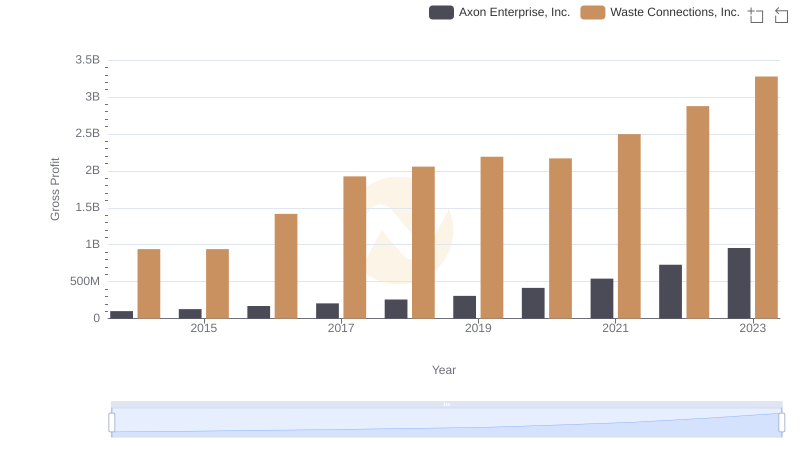
Who Generates Higher Gross Profit? Waste Connections, Inc. or Axon Enterprise, Inc.

Who Generates Higher Gross Profit? Waste Connections, Inc. or Fastenal Company
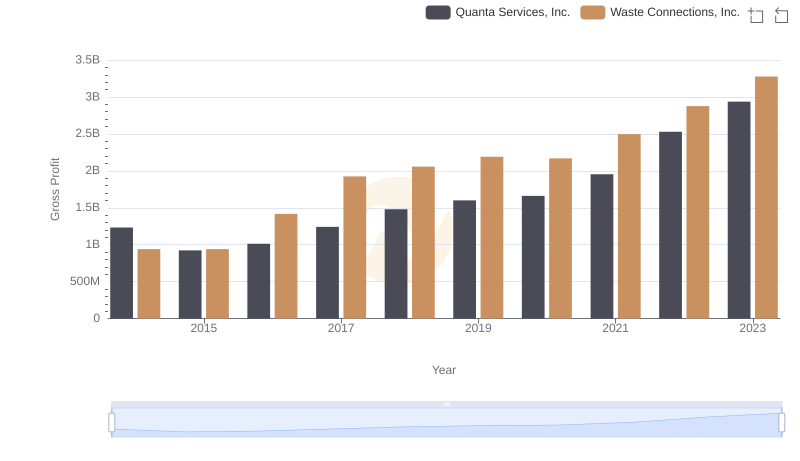
Gross Profit Comparison: Waste Connections, Inc. and Quanta Services, Inc. Trends
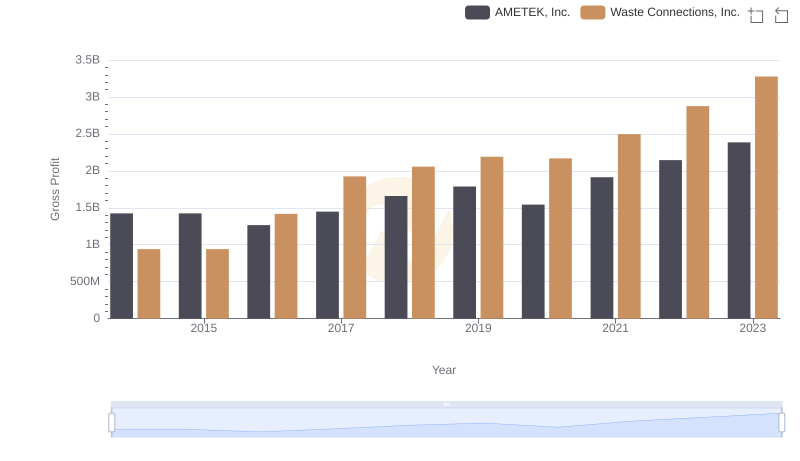
Waste Connections, Inc. vs AMETEK, Inc.: A Gross Profit Performance Breakdown
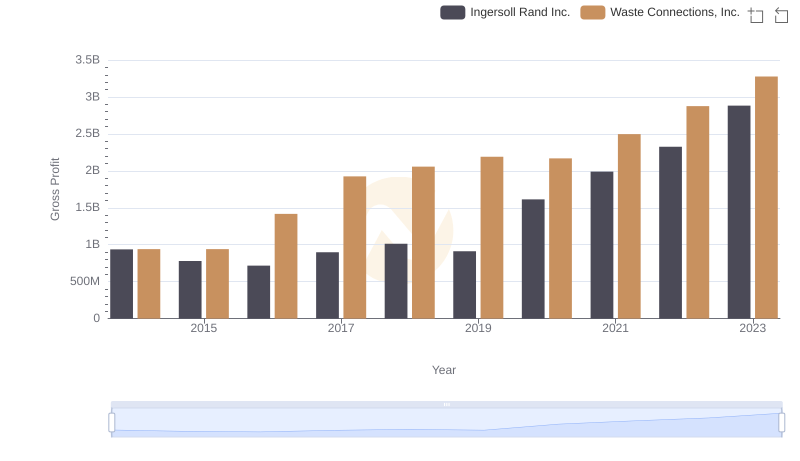
Waste Connections, Inc. vs Ingersoll Rand Inc.: A Gross Profit Performance Breakdown
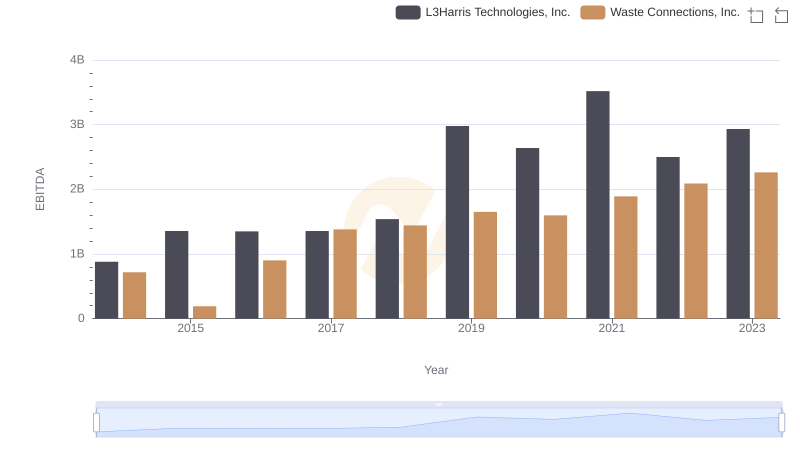
EBITDA Metrics Evaluated: Waste Connections, Inc. vs L3Harris Technologies, Inc.