| __timestamp | L3Harris Technologies, Inc. | Waste Connections, Inc. |
|---|---|---|
| Wednesday, January 1, 2014 | 2370000000 | 1138388000 |
| Thursday, January 1, 2015 | 3832000000 | 1177409000 |
| Friday, January 1, 2016 | 3854000000 | 1957712000 |
| Sunday, January 1, 2017 | 4066000000 | 2704775000 |
| Monday, January 1, 2018 | 4467000000 | 2865704000 |
| Tuesday, January 1, 2019 | 13452000000 | 3198757000 |
| Wednesday, January 1, 2020 | 12886000000 | 3276808000 |
| Friday, January 1, 2021 | 12438000000 | 3654074000 |
| Saturday, January 1, 2022 | 12135000000 | 4336012000 |
| Sunday, January 1, 2023 | 14306000000 | 4744513000 |
| Monday, January 1, 2024 | 15801000000 | 5191706000 |
Infusing magic into the data realm
In the ever-evolving landscape of corporate finance, understanding cost structures is crucial. This analysis delves into the cost of revenue trends for Waste Connections, Inc. and L3Harris Technologies, Inc. over the past decade. From 2014 to 2023, L3Harris Technologies, Inc. has seen a staggering 504% increase in its cost of revenue, peaking at approximately $14.3 billion in 2023. This reflects the company's expansive growth and increased operational scale. Meanwhile, Waste Connections, Inc. has experienced a 317% rise, reaching around $4.7 billion in the same year. This growth trajectory highlights the company's strategic expansion in waste management services. The data underscores the dynamic nature of these industries, with both companies adapting to market demands and operational challenges. As we move forward, these trends offer valuable insights into the financial health and strategic direction of these industry leaders.
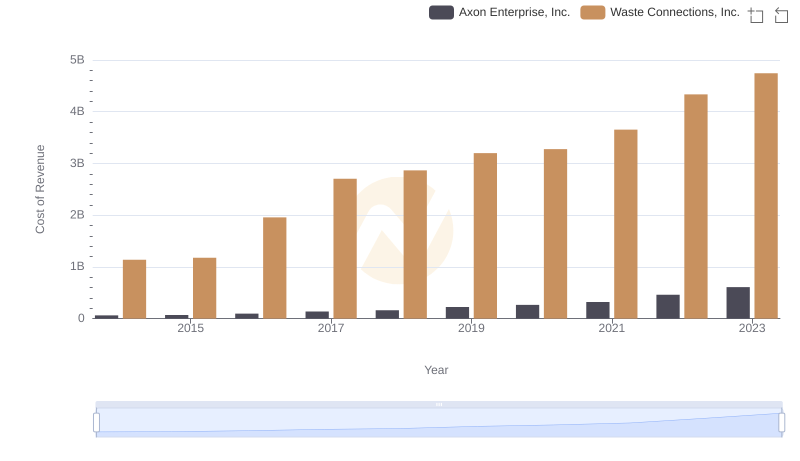
Cost of Revenue Comparison: Waste Connections, Inc. vs Axon Enterprise, Inc.
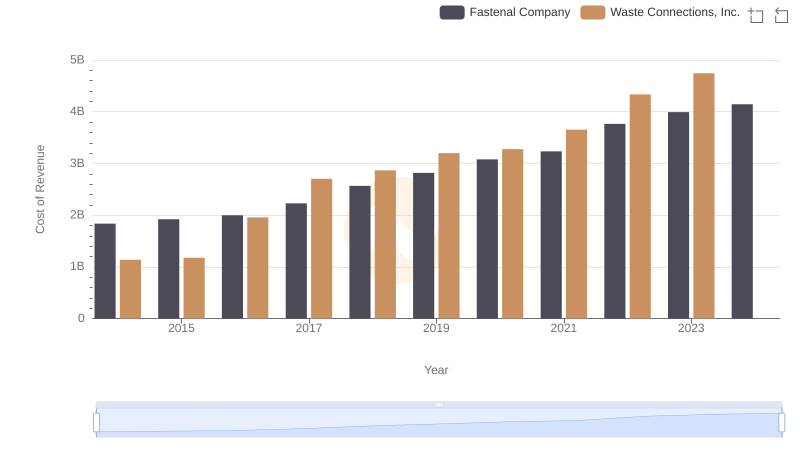
Comparing Cost of Revenue Efficiency: Waste Connections, Inc. vs Fastenal Company
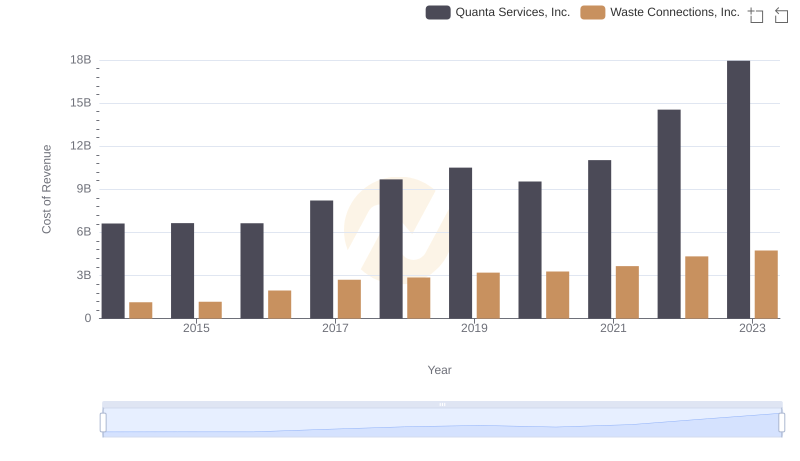
Cost of Revenue: Key Insights for Waste Connections, Inc. and Quanta Services, Inc.
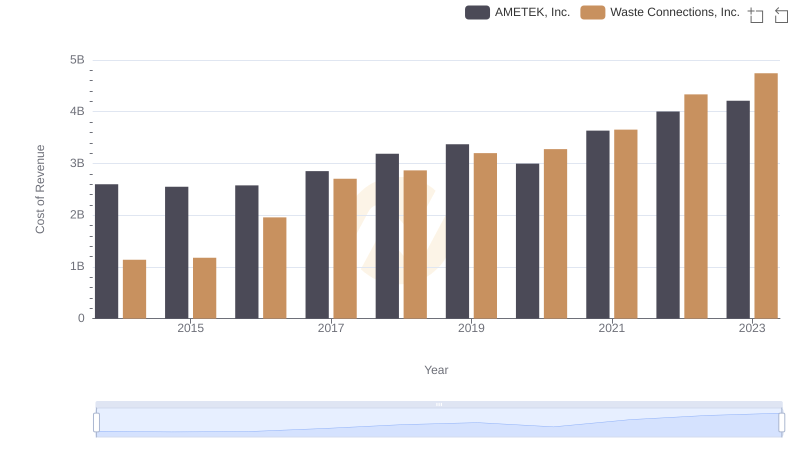
Cost of Revenue: Key Insights for Waste Connections, Inc. and AMETEK, Inc.

Key Insights on Gross Profit: Waste Connections, Inc. vs L3Harris Technologies, Inc.
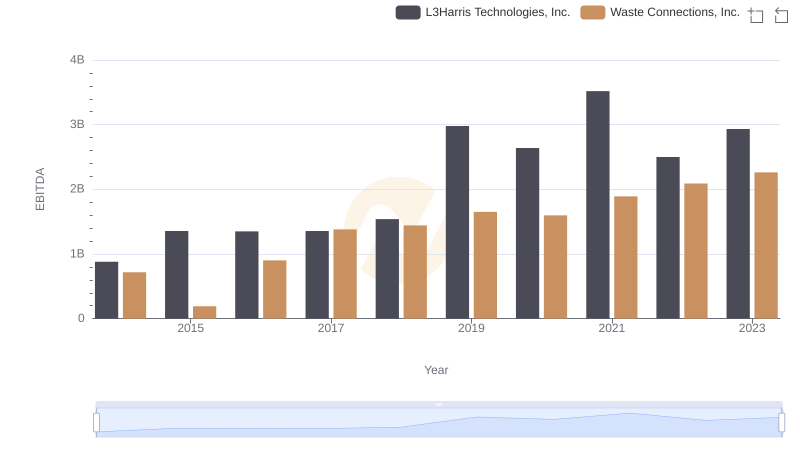
EBITDA Metrics Evaluated: Waste Connections, Inc. vs L3Harris Technologies, Inc.