| __timestamp | Jacobs Engineering Group Inc. | Old Dominion Freight Line, Inc. |
|---|---|---|
| Wednesday, January 1, 2014 | 10621373000 | 2100409000 |
| Thursday, January 1, 2015 | 10146494000 | 2214943000 |
| Friday, January 1, 2016 | 9196326000 | 2246890000 |
| Sunday, January 1, 2017 | 8250536000 | 2482732000 |
| Monday, January 1, 2018 | 12156276000 | 2899452000 |
| Tuesday, January 1, 2019 | 10260840000 | 2938895000 |
| Wednesday, January 1, 2020 | 10980307000 | 2786531000 |
| Friday, January 1, 2021 | 11048860000 | 3481268000 |
| Saturday, January 1, 2022 | 11595785000 | 4003951000 |
| Sunday, January 1, 2023 | 12879099000 | 3793953000 |
| Monday, January 1, 2024 | 8668185000 |
Infusing magic into the data realm
In the ever-evolving landscape of the transportation and engineering sectors, Old Dominion Freight Line, Inc. and Jacobs Engineering Group Inc. stand as titans. From 2014 to 2023, Jacobs Engineering consistently reported a higher cost of revenue, peaking in 2023 with a 21% increase from 2014. Meanwhile, Old Dominion Freight Line saw a steady rise, with a notable 90% increase over the same period. This growth reflects the dynamic shifts in operational costs and market demands. Interestingly, 2024 data for Old Dominion is missing, leaving room for speculation on its future trajectory. As these companies navigate the complexities of their industries, understanding their cost structures offers valuable insights into their strategic priorities and market positioning.
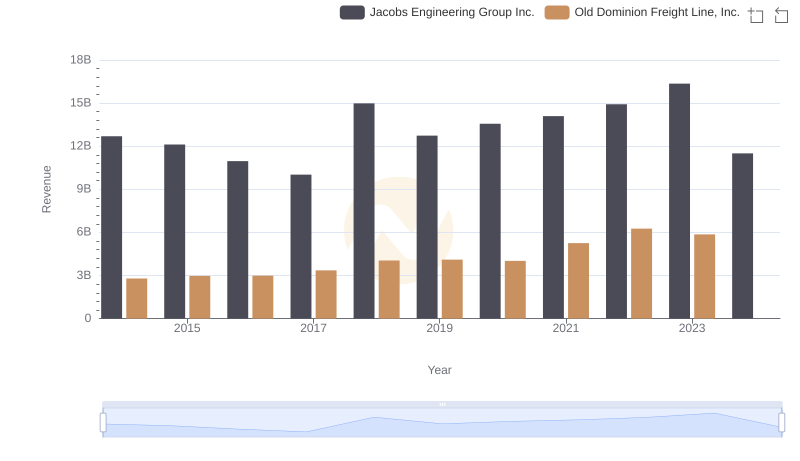
Comparing Revenue Performance: Old Dominion Freight Line, Inc. or Jacobs Engineering Group Inc.?
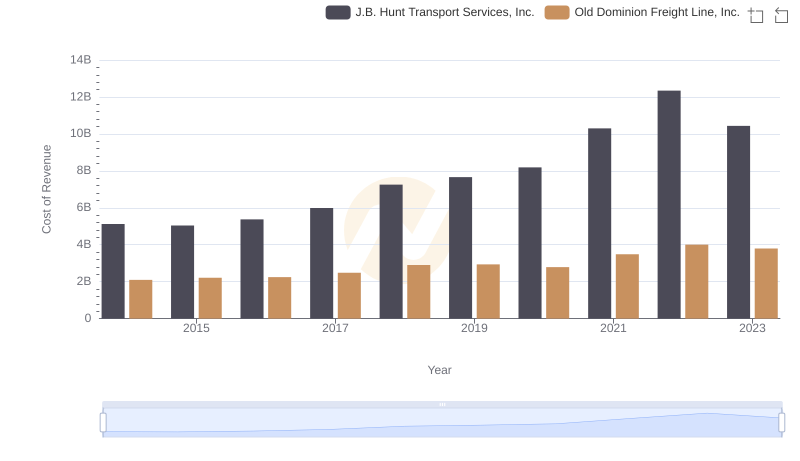
Analyzing Cost of Revenue: Old Dominion Freight Line, Inc. and J.B. Hunt Transport Services, Inc.
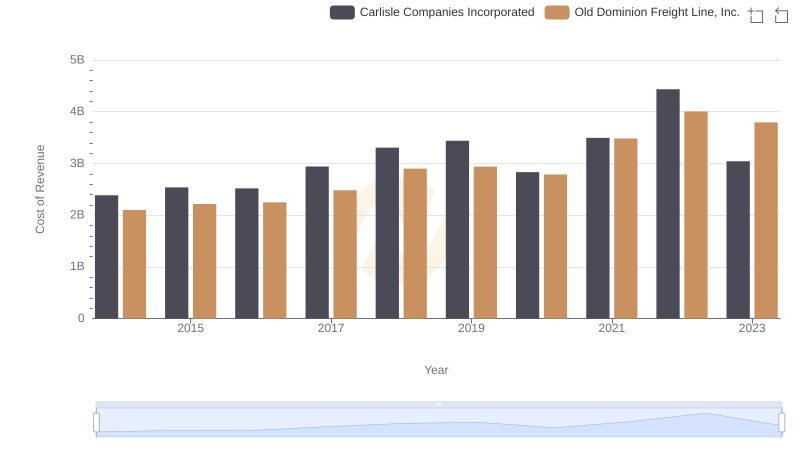
Cost of Revenue: Key Insights for Old Dominion Freight Line, Inc. and Carlisle Companies Incorporated
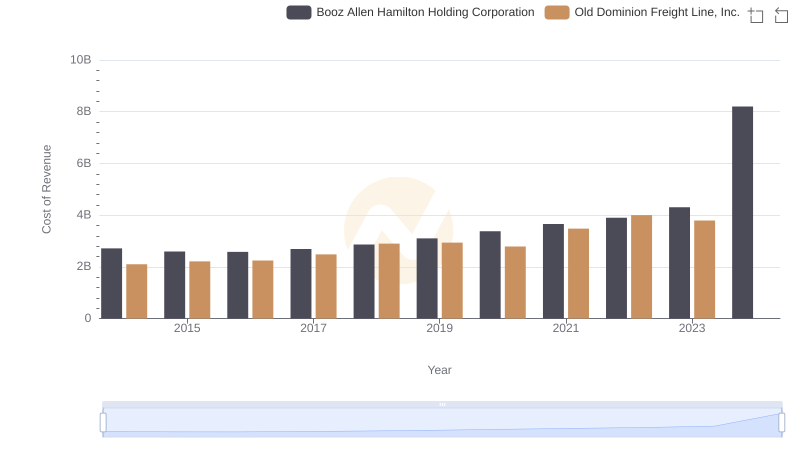
Analyzing Cost of Revenue: Old Dominion Freight Line, Inc. and Booz Allen Hamilton Holding Corporation
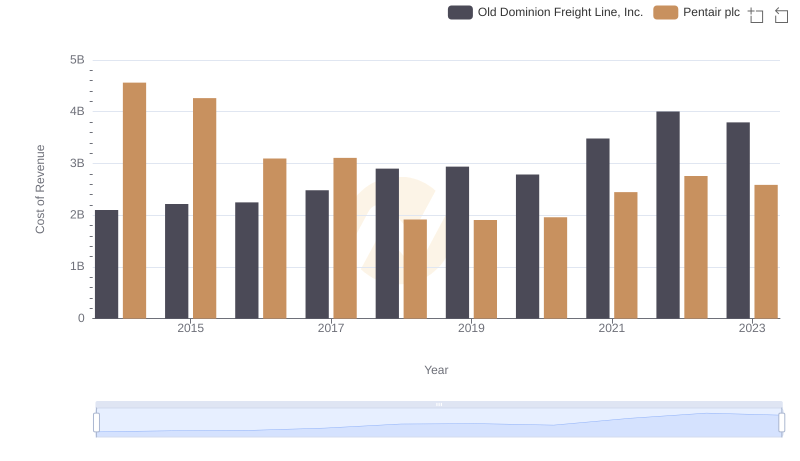
Old Dominion Freight Line, Inc. vs Pentair plc: Efficiency in Cost of Revenue Explored
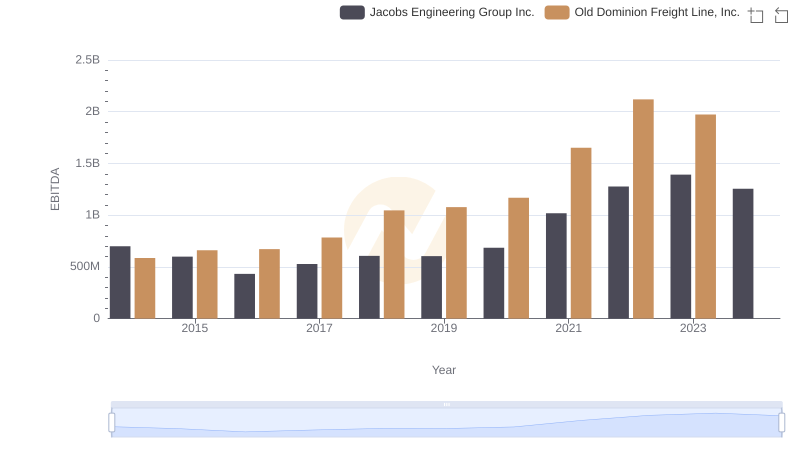
EBITDA Metrics Evaluated: Old Dominion Freight Line, Inc. vs Jacobs Engineering Group Inc.