| __timestamp | Jacobs Engineering Group Inc. | Old Dominion Freight Line, Inc. |
|---|---|---|
| Wednesday, January 1, 2014 | 12695157000 | 2787897000 |
| Thursday, January 1, 2015 | 12114832000 | 2972442000 |
| Friday, January 1, 2016 | 10964157000 | 2991517000 |
| Sunday, January 1, 2017 | 10022788000 | 3358112000 |
| Monday, January 1, 2018 | 14984646000 | 4043695000 |
| Tuesday, January 1, 2019 | 12737868000 | 4109111000 |
| Wednesday, January 1, 2020 | 13566975000 | 4015129000 |
| Friday, January 1, 2021 | 14092632000 | 5256328000 |
| Saturday, January 1, 2022 | 14922825000 | 6260077000 |
| Sunday, January 1, 2023 | 16352414000 | 5866152000 |
| Monday, January 1, 2024 | 11500941000 |
Unleashing the power of data
In the ever-evolving landscape of American industry, two titans stand out: Old Dominion Freight Line, Inc. and Jacobs Engineering Group Inc. Over the past decade, these companies have showcased contrasting revenue trajectories. From 2014 to 2023, Jacobs Engineering's revenue fluctuated, peaking in 2023 with a 29% increase from its 2017 low. Meanwhile, Old Dominion Freight Line demonstrated a robust growth pattern, with revenue surging by 124% from 2014 to 2022. This growth underscores the company's resilience and adaptability in the logistics sector. However, 2023 saw a slight dip, hinting at potential market challenges. Notably, data for Old Dominion in 2024 is missing, leaving room for speculation. As these companies navigate the complexities of their respective industries, their financial performances offer valuable insights into broader economic trends.
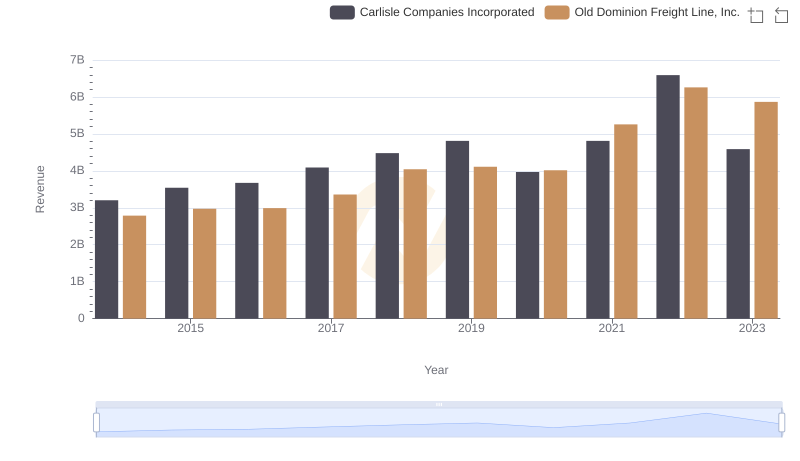
Old Dominion Freight Line, Inc. vs Carlisle Companies Incorporated: Annual Revenue Growth Compared
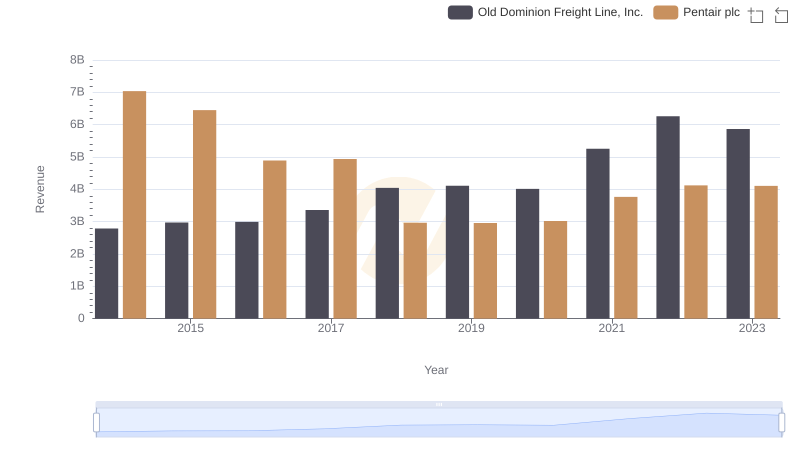
Old Dominion Freight Line, Inc. or Pentair plc: Who Leads in Yearly Revenue?
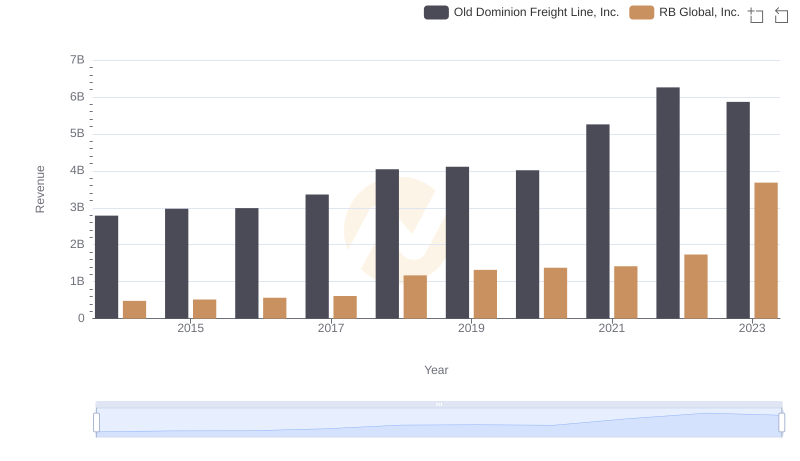
Breaking Down Revenue Trends: Old Dominion Freight Line, Inc. vs RB Global, Inc.
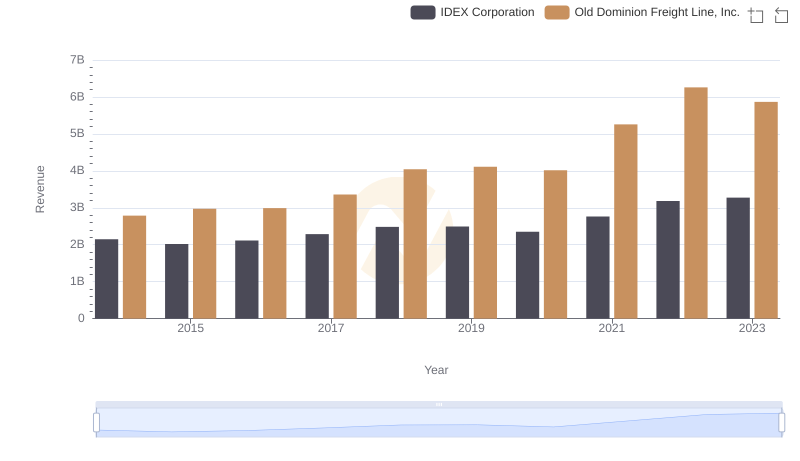
Old Dominion Freight Line, Inc. vs IDEX Corporation: Annual Revenue Growth Compared
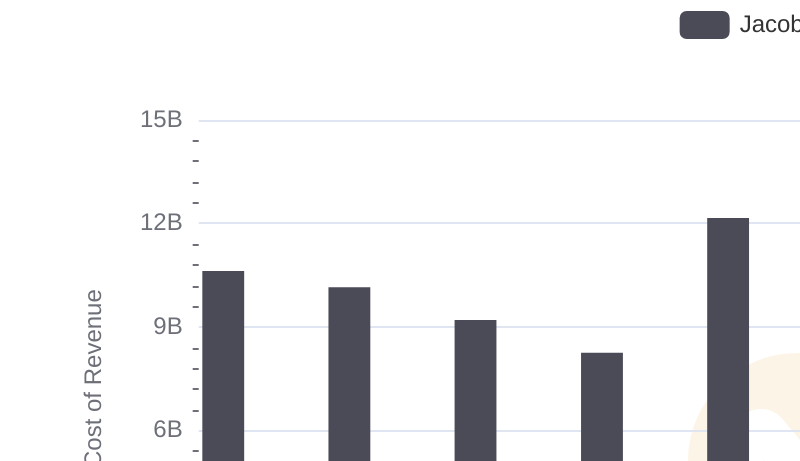
Cost of Revenue Comparison: Old Dominion Freight Line, Inc. vs Jacobs Engineering Group Inc.
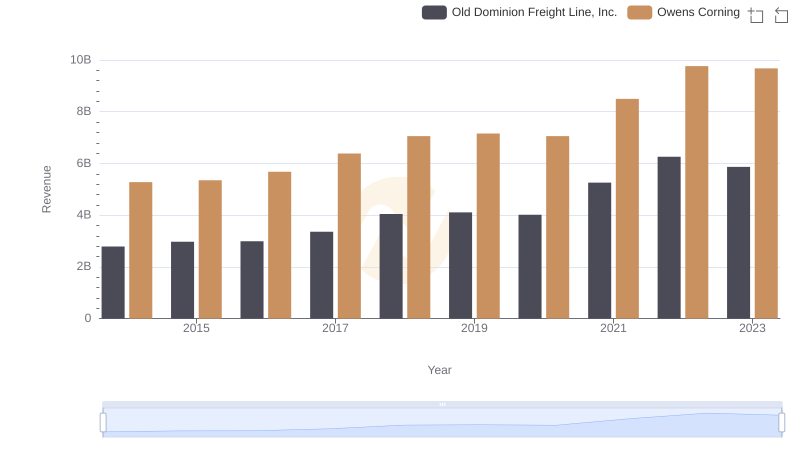
Comparing Revenue Performance: Old Dominion Freight Line, Inc. or Owens Corning?
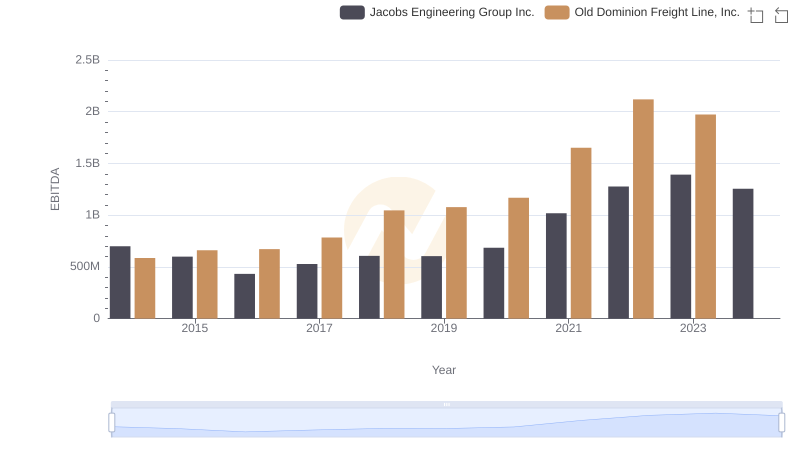
EBITDA Metrics Evaluated: Old Dominion Freight Line, Inc. vs Jacobs Engineering Group Inc.